Use of medical imaging and mortality data and the experimental protocol were approved by the Royal Adelaide Hospital Human Research Ethics Committee. All experiments were carried out in accordance with relevant guidelines and regulations.
The study utilised only pre-existing medical data, therefore patient consent was not required by the ethics committee.
To evaluate the base predictive value of medical imaging using traditional human feature engineering image analysis and deep learning techniques we performed a retrospective case-control study, with matching used to control for non-imaging clinical and demographic variables that were expected to be highly predictive of five-year mortality.
Participants were selected from the Royal Adelaide Hospital (RAH) radiology department archive. All demographic information used in the study was obtained via the DICOM metadata fields of the related imaging studies. Mortality data was obtained via the RAH case-mix department, which receives mortality information for RAH patients from the South Australian Registrar of Births, Deaths and Marriages.
We enrolled 37 sequential decedents with mortality in 2014, who had undergone CT chest scans in the 5 years preceding death and were older than 60 years at the time of imaging. Participants were excluded based on the following criteria: acute visible disease identified on CT chest by an expert radiologist, metallic artefact on CT chest, and active cancer diagnosis (which would strongly bias survival time). A total of 13 cases were excluded, for a total of 24 cases included in the cohort.
24 controls were matched on age, gender, and source of imaging referral (emergency, inpatient or outpatient departments), for a total of 48 image studies included (24 who died within five years of imaging, and 24 who survived beyond five years). The same exclusion criteria were applied. This pair matched study design was utilised to explore the predictive ability of image analysis techniques in this setting without major confounding.
Post contrast CT chest scans were obtained using three types of CT scanners (GE Picker PQ 6000, Siemens AS plus, and Toshiba Aquilion 16) using standard CT protocols at the RAH. CT chest images were obtained in the late arterial phase, following a roughly 30 second delay after the administration of intravenous contrast.
Thick section (5 mm slice-thickness) DICOM images were annotated by a radiologist using semi-automated segmentation tools contained in the Vitrea software suite (Vital Images, Toshiba group), with separate binary mask annotations of the following tissues: muscle, body fat, aorta, vertebral column, epicardial fat, heart, and lungs.
A total of 16,210 image features were defined to assess the segmented tissues and organs. These features were broadly divided into three groups: I) intensity based features, II) texture based features, and III) evidence based features. Intensity features relate to the first order statistics of the intensity histogram, quantifying the density of the tissue. The texture based features include the first and second order matrix statistics of the grey level co-occurrence (GLCM), grey level run length (GLRLM), grey level size zone (GLSZM), and multiple grey level size zone (MGLSZM) matrices. These features were computed over nine directions, at 45 degree intervals along each cardinal axis of the 3-D volume. The intensity and texture based features were extracted using the Radiomics package implemented in R (J. Carlson, https://cran.r-project.org/web/packages/radiomics/).
The evidence-based features were engineered to reflect the pre-existing knowledge of imaging biomarkers in the radiology literature. Cardiac and aortic calcification was quantified using pixel value bins, as per the Agatston methodology31. Due to the presence of IV contrast in the images, results were excluded when the average density of the heart or aorta segment was higher than the lower bound of the calcification density bin (for example, when the aortic average density was 250 Hounsfield units (HU), we excluded “calcification” pixel values below 300 HU). This resulted in many missing data points in the calcification values, particularly at lower density levels.
The degree of pulmonary emphysema was quantified by the presence and extent of low attenuating areas (LAA%)32. Bone mineral density33 was quantified by first order statistical analysis of the intensity (density) of medullary bone, after the exclusion of cortical bone from the vertebral column segment using a density threshold. The slice area and overall volume of each tissue was calculated, reflecting the literature that the dimensions of various tissues (e.g., heart size) are predictive of mortality58.
The task agnostic features were adapted from previous work34 where the methods were applied to localised regions of medical scans, such as in the analysis of small tumours. This task is quite different from the analysis of large organs and tissues, and we expected that the variation in these features over space would be useful in the prediction of disease (for example, the craniocaudal distribution of low attenuation areas in emphysema). To account for these spatial variations the average of each feature was calculated across the whole tissue, as well as within spatial quartiles along each axis. A spatial weighted mean was also calculated for each feature.
The division of features between tissues was as follows: 2506 (aorta), 2506 (heart), 2236 (lungs), 2182 (epicardial fat), 2182 (body fat), 2182 (muscle), 2416 (bone), where 1310 of the total 16,210 features represent evidence-based features. A total of 253 features were excluded for containing missing values, all of which were from the lower density bins of the cardiac and aortic calcification feature set. There were 15,957 remaining image features.
Statistical analysis and predictive models for human-defined features
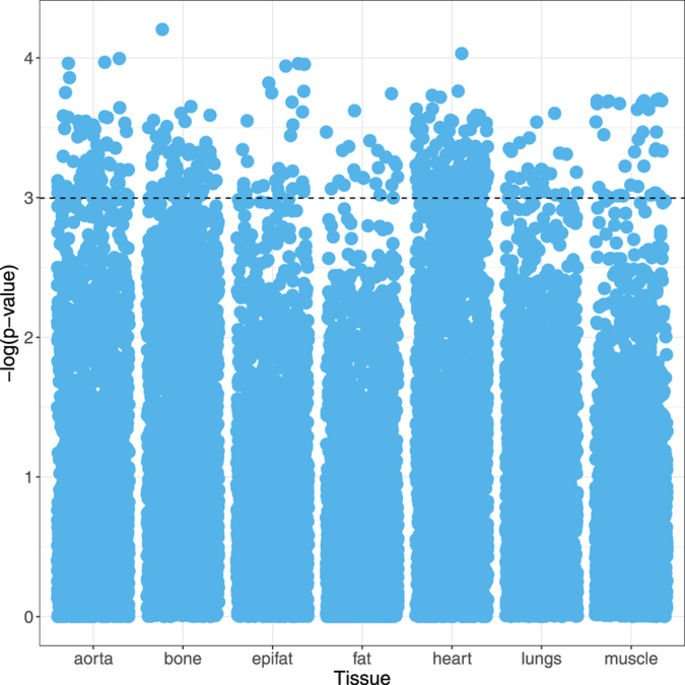
In order to analyse the large number of features extracted, standard statistical techniques used in high-dimensional data analysis (e.g., genomics) were applied. A logistic regression model was fitted to each feature separately, conditioned to account for the pair matched study design. The clinical relevance of each covariate was measured by the p-value, with a significance threshold (α) of <0.05 (i.e., −log(p) >3). The significance and distribution of image features were visualised with Manhattan plots.
A variety of feature selection methods were tested to inform a simplified risk score. These included principal component analysis (PCA)59, L1-constrained regularisation (the Lasso)60, selection methods based on univariate model significance, and minimum redundancy-maximum relevance (mRMR)50. The use of mRMR with 5 selected features was felt to best balance coverage of features from multiple tissues with the risk of overfitting our data. These continuous features were standardised with z-scoring, then summed to form our simplified risk score. This phenotypic score was dichotomised at the median to create “high risk” and “low risk” phenotypic groups. We present raw mortality rates for each phenotype and Kaplan-Meier curves to demonstrate the discriminative ability of the score.
The exploration of the feature distributions and the mortality risk score survival models were both performed on the entire dataset (training and testing data), as neither process involved model selection or hyperparameter tuning.
Mortality classification was performed to assess the predictive capacity of the engineered features using a variety of standard classifiers including linear and non-linear support vector machines, random forests, and various boosted tree methods. Model selection was performed via cross-validation within the training data.
Due to computational constraints, only the random forest classifier was applied to the full set of 15,957 engineered image features. For the other classification methods, two feature selection approaches were implemented with Lasso regression and principal components analysis. Selection with the Lasso within each fold identified between 4 and 20 features. PCA identified 16 principal components accounting for 95% of the variation in the data.
The most performant model was the random forest classifier without feature selection (i.e., with all of the human-crafted features as the input), with 150 trees and 16 variables randomly sampled at each split.
A convolutional neural network (ConvNet) was designed to predict all-cause mortality. While the architecture of this network was informed by current standard practices in the field, several alterations were required to deal with the unique aspects of CT image data.
The basic ConvNet architecture was determined by model selection using the training data. We explored a range of combinations of layer depth, layer size, and various combinations of non-linearities. The selected model (see Fig. 5) used in this work had three convolutional layers with 50 filters in the first layer and 100 filters in the second to fourth layers, where the filters had size 5 × 5 × 2. There were max pooling operations after the first and second convolutional layers, with a pooling size of 2 × 2 × 2. The first convolutional layer had rectified linear units (ReLU)61. After the third convolutional layer there was a fully connected layer containing 6,000 nodes, and the output layer had two nodes with softmax activation. For training, dropout of 0.35 was applied in all layers62. The learning rate started at 0.0005, from epochs 1 to 10, which was then continuously reduced until it reached 0.00001 from epoch 60 to 120. We optimised with RMS prop63 with ρ = 0.9.
Figure 5 Schematic of the deep learning architecture for the mortality classification task. Full size image
We determined the optimal architecture for this deep learning model empirically, testing numerous variants. In particular we note that changing the depth of the network reduced performance, and the size of the fully connected layer was positively associated with prediction accuracy. We did not increase our model depth beyond 6,000 hidden units due to computational constraints.
Cross-sectional medical image volumes are much larger than the images that are usually analysed with ConvNets. To reduce the complexity of the problem, the large CT volumes (512 × 512 pixels, with 50–70 slices per case depending on the length of the patients’ lungs) were downsampled to 64 × 64 × 11 volumes using bicubic interpolation. 3d convolutions were implemented to manage the volumetric nature of the data, in keeping with the general practice in computer vision research of matching the dimensions of the convolutions to the data. The addition of the seven binary segmentation masks as channel inputs in the model was intended to promote the learning of anatomy based models for the prediction task: the distribution of tissues which contain predictive but very different features. For instance, the features that predict mortality in the lungs are assumed to be different from the predictive features in the vertebral bodies. With the segmentation maps the dimensions of the input tensor for each case were 64 × 64 × 11 × 8, where the final dimension is not spatial but is incorporated as a “channel” for each pixel (similar to RGB channels in colour photographs).
The feature engineering and deep learning analysis pipelines are demonstrated in Fig. 6.
Figure 6 Diagrammatic representation of the analysis pipelines with engineered features and deep learning methods. Full size image
We assess the predictive performance of the feature engineering and deep learning methodologies based on a 6-fold cross-validation experiment, where we form six training sets, each containing 40 cases, and six testing sets, each with eight cases with no overlapping between training and testing sets in each fold. The classification performance is measured using the receiver operating characteristic (ROC) curve and area under the ROC curve (AUC)64 using the classifier confidence on the 5-year mortality classification, as well as the mean accuracy across the 6 experiments.
Qualitative visual comparison was made between the cases correctly identified as mortality or survival cases by the deep learning and feature engineering models. The strongest predictions averaging the results of the two models were identified and reviewed by a consultant radiologist. This was performed to demonstrate “face validity”, that the model predictions can identify similar patterns and patients as the assessment of a clinical expert.
The datasets generated during and/or analysed during the current study are not publicly available due to the clinical and confidential nature of the material but can be made available from the corresponding author on reasonable request.
grambell789 on June 7th, 2017 at 04:01 UTC »
Yeah because it can 'schedule' an 'accident' and get rid of you when ever it wants.
cartoonassasin on June 7th, 2017 at 02:47 UTC »
I'm with Roy on this subject.
Stretch92009 on June 7th, 2017 at 02:44 UTC »
I don't need an ELI5 here, but would someone please ELI not a radiologist or scientist, please?