A few days ago, I took a look at how MLB teams stacked up to one another over the course of about 140 years. Looking at winning percentages, it became clear that – in general – big market teams had better historical win/loss records thanks to the ability to spend more on quality players.
It also became apparent that even the highest ranked team (New York Yankees) had only won about 57 out of 100 games on average throughout the last ~110 years. Longer seasons give teams a better chance to hover around .500 over the course of generations.
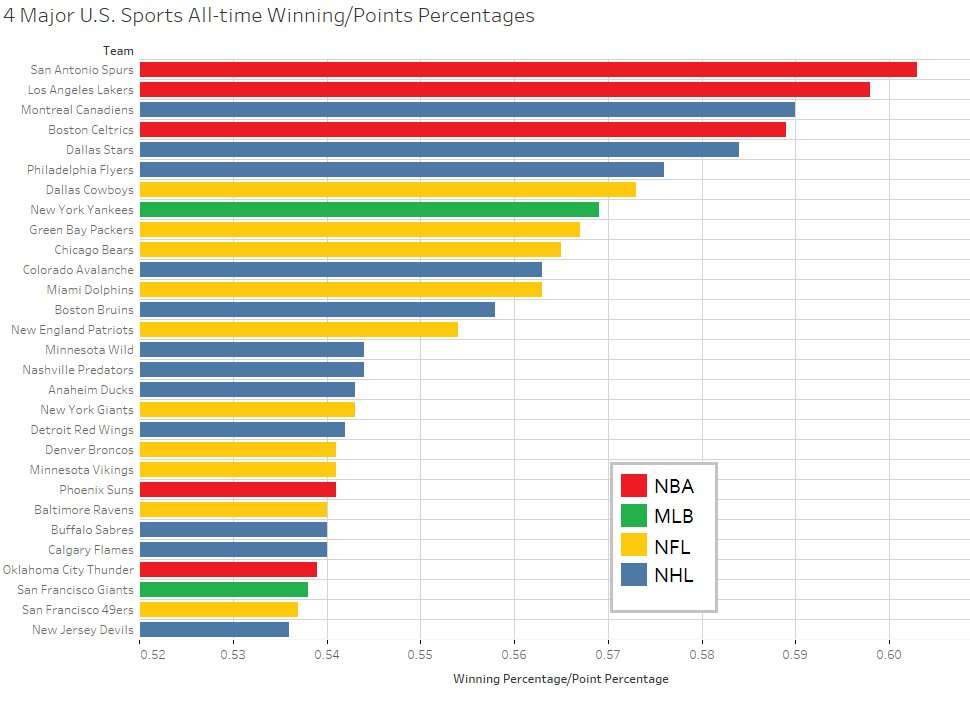
Going further, I thought it would be interesting to see what the best winning percentages were across all of the major U.S. sports. The NHL uses a slightly different point scoring system, which was calculated into the chart below, but the results were kind of surprising:
Right off the bat, we see that three of the top four teams are NBA teams. It should be noted that ABA records are included with NBA teams, so there is a deeper well of statistics from which to pull for a few of the merger teams, but of the top 29 teams overall, only 5 come from the NBA. This essentially means that the Spurs (.603), Lakers (.598) and Celtics (.589) have been beating up on the rest of the league over the decades.
One way to explain this is that individuality plays a far greater role in NBA games than any of the other sports leagues. LeBron James essentially turned the Cavaliers into a championship team just by putting him on the roster. Much the same way the Stephen Curry has the Warriors playing at a high level and how Russell Westbrook and Kevin Durant (I’m sorry OKC fans) made the Thunder an elite team.
For other sports leagues, having a great quarterback, pitcher, or goalie can help a lot, but there are so many other team positions and players, all of whom need to form a cohesive unit in order to win consistently.
NFL and NHL teams are relatively well-represented in the top chart with 22 teams, showing at least a bit of parity in the respective leagues. NFL stats are a bit quirky due to the relatively short schedule they play, giving more weight to each individual victory, while the NHL has a clear historical higher and lower echelon of teams.
The highest MLB winning percentages are low compared to other sports precisely because of the length of the MLB season. Each individual victory is nearly drowned out by historical records. When some teams have played 20,000 games, a win or loss, especially when teams are much more equal in terms of talent and production these days, will not move the numbers much.
Mathletics: How Gamblers, Managers, and Sports Enthusiasts Use Mathematics in Baseball, Football, and Basketball
ahh_sheesh on April 9th, 2017 at 00:21 UTC »
Amazing that the highest winning percentage of all time comes from a "small market" city. Shows how amazing of a run Popovich and Co. have had.
_ft_ on April 9th, 2017 at 00:02 UTC »
I'd be interested to see the worst teams to see how they look. The tricky part is that failed franchises may skew the results. Maybe it would be good to see the worst teams that have lasted 30+ years and then understand why they are consistently outperformed by their peers.
burnSMACKER on April 8th, 2017 at 23:48 UTC »
>Boston Celt**r**ics (on the graph) Also, it's impressive how high up the Montreal Canadiens are considering they are a 108 year old team. But I'm not sure if the stats are reaching back that far.