A new stratospheric Polar Vortex has now emerged over the North Pole and will continue to strengthen well into the Winter of 2021/2022. It will interact with a strong easterly wind anomaly high over the tropics. This interaction happens every few years and has actually brought colder winters to Europe and the United States in the past.
Before explaining what is coming for the Polar Vortex and our Winter weather, we will quickly learn what exactly is the Polar Vortex. We try to explain this in most of our winter articles, as knowledge is essential and powerful, so why not learn something new very quickly along the way.
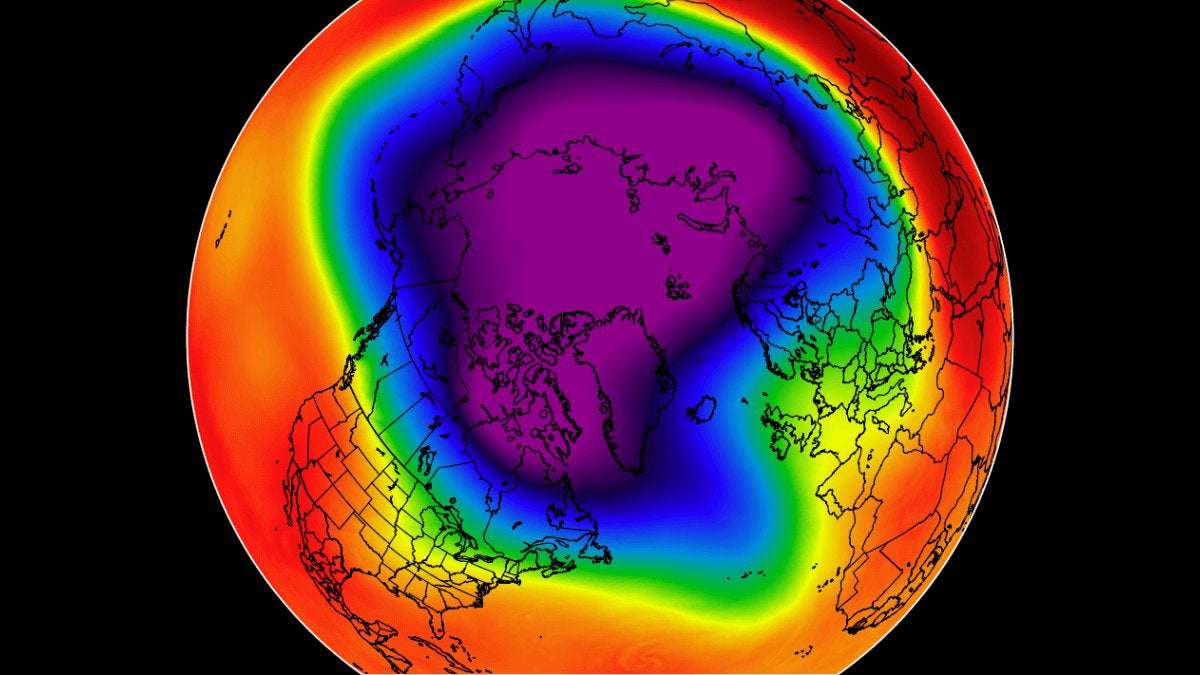
In essence, the polar vortex is like a large cyclone, that forms when the stratosphere over the North Pole starts to cool down. The image below shows an example of the pressure pattern in the lower stratosphere, with the Polar Vortex covering the Polar Regions and down into the mid-latitudes. But what exactly is this “stratosphere”?
All of the clouds (and the weather that we feel) are found in the lowest layer of the atmosphere called the troposphere. It reaches up to around 8 km (5 miles) altitude over the polar regions and up to around 14-16 km (9-10 miles) over the tropics.
Above it, there is a much deeper layer called the stratosphere. It is a very dry layer, around 30km thick. This is where the ozone layer is. You can see the layers of the atmosphere on the image below, with the troposphere on the bottom and the Stratosphere with the ozone layer above it.
When you hear people talk about the polar vortex and its influence, 90% of the time they talk about the higher altitude stratospheric part. While the stratospheric polar vortex is spinning high above our weather (tho strongly connected), it plays a major role in the developing winter weather patterns across the entire Northern Hemisphere.
Every year as we head into autumn, the north pole starts to cool down. But the atmosphere further south is still relatively warm as it continues to receive energy from the Sun. This temperature difference causes a pressure drop over the polar regions.
As the temperature and pressure drop over the pole and the temperature difference towards the south increases, a large low-pressure (cyclonic) area will start to intensify across the Northern Hemisphere. The same process happens in the stratosphere, creating a large anti-clockwise spinning system.
The image below shows a typical example of the Polar Vortex at around 46km altitude (1mb level) near the top of the stratosphere.
You can see that the polar vortex really is like a very large cyclone, covering the whole north pole down to the mid-latitudes. It is strongly present at all levels, from the ground up, but in different shapes.
The next image below will show you the temperature at around 5km altitude, revealing the true shape and size of the polar vortex closer to the ground (cold colors). The closer to the ground we get, the more deformed the polar vortex gets, due to the growing influence of the terrain and the many weather fronts and systems.
You can see on the image above what the true extent of the polar vortex looks like at lower altitudes in Winter. Be aware of its “arms” extending into eastern and western United States, also bringing along colder air into the region in early February 2021, which is the date of the image.
For an even better idea, we produced a high-resolution video for you below, which very nicely shows the Polar Vortex spinning over the Northern Hemisphere at around 5km altitude. In the video, you can see the temperature at this altitude, as the temperature nicely shows the actual size and shape of the complex structure of the Polar Vortex at lower altitudes.
Currently, the temperature is already dropping in the stratosphere. The image below shows the temperature difference forecast in the next two weeks, in the middle stratosphere. We can see the large-scale cooling over the majority of the North Pole.
Looking at the actual temperature forecast, we can see a nice cold-core starting to develop over the Polar Circle. This is the heart of the Polar Vortex, as the colder it gets, the stronger the polar vortex can become. That is because it feeds off the temperature/pressure difference between the polar and the southern regions of the Northern Hemisphere.
The pressure is also starting to drop rapidly. The image below shows the geopotential height of 10mb level (~30km altitude), we can see the smaller low-pressure area starting to develop over the Arctic Circle. That is the foundation for the polar vortex of the upcoming winter 2021/2022.
Towards late September, shown on the forecast image below, we can see the polar vortex is much more developed, and rapidly increasing in size and influence. As the pressure drops in the polar vortex, this increases its wind speed. The stronger it gets, the easier it is to influence our weather down at the surface.
Speaking of wind, the current forecast shows the stratospheric jet stream developing. This is also called the Polar Night Jet. The image below shows the stratospheric jet stream in the upper stratosphere at 1mb level (~45km/28mi altitude)
Looking at the 10mb level (~30km/18.5mi altitude) forecast, we can see the stratospheric jet stream at this level. It has a nice oval shape and is already almost connected across the entire Northern Hemisphere.
The strength of the stratospheric jet stream at the 10mb level is usually used to determine the strength of the polar vortex and its potential influence on weather in the winter when it is at its strongest. Current forecasts, when compared to the long-term average, show that the late September strength of the polar vortex is likely to be higher than usual.
That is seen in the image below which shows the forecast of the stratospheric jet stream at 10mb (~30km), compared to the long-term average (yellow line). This might not mean much for now, but it shows that the polar vortex is having a more energetic start than usual so far. Graphic by Simon Lee.
We can also take a look at the vertical pressure profile, to see what are the expected changes in the lower levels. The first image shows the analysis for Sept.11th. This image basically shows the pressure anomalies with altitude over the Polar regions. Currently, we can see a stronger low-pressure area in the upper stratosphere, extending down, but nothing major.
Looking at the 10-day forecast, we can see that the direct connection between the higher stratosphere and the lower atmosphere is not there. This is partially due to strong pressure systems across the Northern Hemisphere.
Looking ahead, the connection looks to be re-established in late September. Low-pressure anomalies look to connect down from the higher levels of the stratosphere. Looking at the corresponding longitude, we can actually find the connection area at the surface.
For that, we will use the pressure anomaly forecast. Note that this is a 16-day forecast and will change completely. But it serves as a good example. We can see a deeper low-pressure system over the Arctic ocean, down to 975mb. This is the main connecting spot of the stratospheric polar vortex and the surface pressure patterns.
But polar vortex is just one part of the overall Winter 2021/2022 story. You will now see another major factor that we mentioned in the intro, the strong wind anomaly high over the tropics. That anomaly is called the Quasi-biennial Oscillation, also known as the “Heartbeat of the Atmosphere”.
First, we need to look at the winds over the entire planet, from the south pole to the north pole. We produced a unique image below, which is quite simple to read. It shows the forecast of west-to-east (zonal) winds over the entire earth, from the south pole (-90°), over the Equator (0°) to the north pole (90°).
Positive values indicate westerly winds, while negative values indicate easterly winds. The graphic shows the winds from the surface up to around 60-65km/37-40mi altitude. We have marked a few areas of interest, that really stand out.
Black box: This shows the very strong stratospheric jet stream over the southern hemisphere. This is currently associated with a strong stratospheric polar vortex over the South Pole. We can see its connection down to the tropospheric jet stream, directly influencing the weather.
Violet box : Here we have our own stratospheric jet stream developing over the northern hemisphere. It is not nearly as strong as the one over the south pole, but it is in its early stages, and will keep getting stronger all the way towards the end of December 2021.
Blue box : This is the “regular” jet stream as we know it, in the troposphere, at around 8-10km/5-6mi altitude. We can see that it is not very strong yet, as it is just entering its Fall mode. We can also see that it is not yet connected fully with the main stratospheric jet stream.
Red box : This is the only strong area of negative values (easterly winds). It is more important then it might look at first. This shows the Quasi-Biennial Oscillation (QBO) above the Equator, a regular shift in wind direction from west to east.
The Quasi-Biennial Oscillation(QBO short), is a regular variation of the winds high above the equator. Strong winds in the stratosphere travel in a belt around the planet, and around every 14 months, these winds completely change direction. This means that every year or so winds high above the equator change from west to east.
A wind analysis below for the 30mb level (~24km/15mi), shows this easterly wind stream above the tropical regions. It is currently in negative values, which reveals that easterly winds are prevalent. This means that the QBO is in the east mode.
We can see these west and east phases in a quite simple image. Below we see the zonal (W-E) winds in the stratosphere above the equator over time. It is obvious right away that this is a very regular shift from west winds (positive values) to the easterly winds (negative values). Notice how each phase is descending slowly over time.
This shift from west to east winds is so regular, that it gave QBO the nickname “heartbeat of the atmosphere“. Each phase slowly descends down over time, from the middle stratosphere around 10mb (~30km/18.5mi) down to the top of the troposphere around 100mb (~17-18km/11mi).
Below we have a special graph, that shows the zonal wind anomalies for the past 40 years at around 24km/15mi altitude. It nicely shows just regularly this wind shift really is, like watching a heart pulse.
Looking more closely at the past 3 years, we can see how each phase descends over time. A west phase in 2019, a weak negative in 2020, followed by a positive last winter, and the new negative descending down for Winter 2021/2022. The image below is from NASA analysis.
If we look specifically at 2021 alone, there is a very obvious fast descent of the easterly winds. It accelerated in early Spring and continued all to today. Currently, it is holding its level, not descending further, which is a typical occurrence. It will continue to descend during Winter 2021/2022, being replaced by a westerly phase in 2022.
A radiosonde analysis from Singapore also shows the wind direction above the tropics. It reveals the easterly winds around the 10-50mb level, confirming the east QBO phase will be dominant this winter.
The QBO is an important part of weather development in winter, as it can affect the North Atlantic jet stream. The speed of the winds in the Atlantic jet stream weakens and strengthens with the direction change of the QBO. The jet stream is an important atmospheric feature that brings us our weather, and the risk of winter conditions across the Northern Hemisphere can differ depending on the phase of the QBO.
When the QBO is easterly, there is an increased chance of a weak jet stream, sudden stratospheric warming events, and colder winters in Northern and Central Europe and the United States.
When the QBO is westerly, the chance of a strong jet, a mild winter, winter storms, and heavy rainfall increases.
The image below shows the correlation between the QBO and surface temperatures in the Winter season. More specifically, this shows the signal for the easterly QBO which we will have this Winter. We can see a tendency for colder temperatures over the southern and eastern United States, and over Europe. The signal is not so strong, however, as there are a lot of other “winter influencers” out there.
There is more than one reason why QBO can influence our Winter weather. One very important aspect is of course the Polar Vortex, which is why we mentioned QBO in this article in the first place. The image below shows the connection between the east QBO and the Polar Vortex in the December-January winter period.
We can see a signal for a higher pressure over the polar stratosphere, which indicates a weaker Polar Vortex. That is usually associated with a Sudden Stratospheric Warming (SSW) events. These are very powerful weather events that occur high up in the Polar stratosphere, but usually come crashing down, impacting the weather across the entire Northern Hemisphere.
Simplified, a Sudden Stratospheric Warming event (SSW) is exactly what the name suggests. It is a sudden temperature rise in the polar stratosphere during winter. Warming of the stratosphere means that the polar vortex is weakened, and can also collapse under the pressure from the warming event.
The source of the warming usually comes from the bottom up, as strong weather patterns can actually deflect a lot of energy upwards into the stratosphere, disrupting its dynamics.
A strong polar vortex usually locks the cold air into the Polar region, creating milder winters for most of the United States and Europe. A Polar Vortex collapse is just as dynamic as it sounds, as the higher pressure comes crashing down, pushing the cold air out of the polar regions, into the United States and/or Europe.
This creates a chain reaction, which can disrupt the jet stream, and creates high pressure over the Arctic circle, releasing the cold arctic air into Europe and the United States. An SSW event is usually triggered by specific massive pressure patterns in the troposphere, which can send a lot of energy upwards vertically into the stratosphere.
Below we have example images from the great SSW analysis siteat ESRL/NOAA, which shows two examples of winters with an SSW event. The winter of 1984/1985 and the winter of 2008/2009.
The top row shows the stratospheric conditions, with warming anomalies, and a polar vortex split into two parts. The bottom row shows the surface temperature anomalies, following these events, with the very cold winter in 1985 and cooler weather after the 2009 SSW event.
Looking closer at the 2009 warming event, we can see the stratospheric warming (red colors) as it slowly progressed downwards over time. It eventually connected with the surface, raising pressure over the North Pole, and releasing the colder air into western and central Europe and the northern United States.
If we combine all Stratospheric Warming events and look at the weather 0-30 days following the stratospheric warming events, we get an interesting picture. We can see below that the pressure usually rises above the Polar regions, and drops over Europe and the western Atlantic.
Below we have the corresponding temperature 0-30 days after an SSW event. Most of the United States is trending colder than normal, and also Europe, with the exception of the southeast parts. Note: this is an average picture of many SSW events. Each individual stratospheric warming event is different and does not automatically mean a strong winter pattern.
To see a practical example, look no further than last winter. We witnessed strong stratospheric warming this year in early January, which was during a west QBO, and might come as a very slight surprise, as negative (east) QBO is usually more favorable for such an event.
On January 5th, the preliminary date of the Sudden Stratospheric Warming event was marked, as the winds around the polar circle have reversed. The stratospheric warming wave has crawled over the entire North Pole in the stratosphere, effectively splitting the cold-core of the polar vortex into two parts.
One part of the broken polar vortex has moved over North America and one over the European sector. At this point, this does not have much to do directly with the winter weather on the surface, since this is at a 30km altitude. But the weather influence followed quite soon after.
The strength of the polar vortex is usually measured by the power of the winds it produces. This is done is by measuring the zonal (west to east moving) wind speeds around the polar circle (60°N latitude). We can track this stratospheric warming event by looking at the temperature and wind speeds.
Below we have an analysis graph from the NASA monitoring system, where you can see a very interesting progression in the 2020/2021 Winter Season.
In early December, the polar vortex was at a strong level, reaching over 40m/s (90mph) zonal wind speeds. Towards mid-month, and especially towards late December, the polar vortex began to weaken. We can see the stratospheric zonal winds became negative in early January, due to the warming event that collapsed the polar vortex.
Looking at the NASA temperature analysis for the polar stratosphere, we can see the large temperature spike at the 10mb (30km) level. This shows a strong warming event, with temperatures staying above normal for weeks after. Rapid cooling began in early February, as the polar vortex recovered some of its strength.
When trying to find a connection between the stratosphere and our winter weather, it helps to have more specialized images at hand. Especially one that shows altitude and time.
The image below shows an atmospheric pressure index. Negative values indicate lower pressure (blue colors) and positive values indicate higher pressure (red colors). We have altitude from the ground up to the top of the stratosphere (~46km/28mi) for the Winter/Spring 2021 period.
You can see strong positive values in the stratosphere in early January, associated with the higher pressure buildup during the stratospheric warming event. The event and/or its influence was slowly descending over time, reaching the lower levels by mid and late January. This persisted well into February, influencing the weather circulation even when the stratospheric warming was already over.
We produced an analysis image of the January-February 2021 winter period, showing pressure and temperature anomalies. The first image below shows the pressure anomalies, where you can see a strong high-pressure system dominating the North Pole. This dominant high-pressure system originated from the stratospheric warming event and the polar vortex collapse, as we showed in the image above.
A strong high-pressure system over the Arctic can heavily disrupt the weather circulation and can unlock the cold air from the Arctic regions towards the mid-latitudes.
The image below shows the temperature anomalies in January-February 2021 period. Warmer than normal temperatures were present under the high-pressure system over the polar regions. But cold Arctic air was pushed out heavily into Siberia, and also into western Canada and the south-central United States.
We now know what the polar vortex is and what the QBO is. The QBO is found in the stratosphere above the equator and is connected to the global large-scale circulation. The west or east phase of the QBO can have a different effect on the polar vortex and the development of a Stratospheric Warming event. In most cases, the east phase of the QBO is more favorable for a better winter pattern in the United States and Europe.
We have also discussed the La Nina phase of the ENSO and its influence in our Fall forecast 2021, so check it out for more details on what exactly is the La Nina and the ENSO cycle. Historically, a La Nina winter has around 60-75% chance of producing a stratospheric warming event. It has produced them in the past and also in the last winter.
Below we have the ENSO forecast from BoM Australia, which shows the La Nina phase for late Fall and through the Winter 2021/2022.
Without a stratospheric warming event, a La Nina winter can generally be milder in Europe and the United States. But combined with a negative QBO, it can change the weather patterns. This is why the state of the stratospheric polar vortex is important, as well as the phase of the QBO.
Current signals show the potential for a stratospheric warming event in mid-winter, based on current parameters. A lot depends on the positioning of the massive high and low-pressure systems in the North Pacific.
This is where other short-term factors also come into play, like weekly weather variability, tropical convection, ocean temperature anomalies, etc…
We will soon take an early look at the first model winter forecast for Winter 2021/2022. We will further analyze the current state of the oceans and the atmosphere, and what are the expected scenarios, based on the latest model forecasts.
We will keep you updated on the global weather activity and forecasts, so make sure to bookmark our page. Also, if you have seen this article in the Google App (Discover) feed or social media, click the like button (♥) to see more of our forecasts and our latest articles on weather and nature in general.
Worldwide Automobile Delivery Could See Months of Delay as Monster Typhoon Chanthu Heads for a Destructive Impact on Taiwan This Weekend
Logical_Pop_2026 on September 12nd, 2021 at 08:23 UTC »
So what you're saying is we should expect another 1 in 100 year freeze in Texas?
yildrimqashani on September 12nd, 2021 at 05:24 UTC »
Wait I think I’ve seen this movie… when do I run for the NY central library?
_tropical_tundra_ on September 12nd, 2021 at 03:14 UTC »
Here’s the TLDR:
The polar vortex is forming - as it does every year The tropical equatorial winds are moving east until the end of the year A warming event is expected to pull even more cold air down The US, central and Northern Europe will be freezing their asses off.So store up on hot cocoa. (I may have added that, read the article to figure out if I did.)