Updated CO 2 emission and global temperature forecast
We first produce the forecast for fossil fuels and industry CO 2 emissions for most countries with the updated data, using the fully statistical probabilistic model of Raftery et al.1. The model is based on the Kaya identity at the country level, which expresses future emissions levels as a product of three key drivers: population, GDP per capita, and carbon intensity (CO 2 emissions per unit of GDP).
We forecast these three components jointly. For population, we use the probabilistic population forecasts from the United Nations9. The model for GDP per capita is based on the world frontier model of Lucas10. It assumes that there is a world frontier represented by the currently most advanced country (the USA over the historical period for this study), and that other countries move stochastically towards the frontier at country-specific speeds. This model allows countries to have high GDP growth in the short term if that is the recent trend, but does not allow unrealistically high growth rates in the long term, as countries approach the world frontier. Carbon intensity is modeled as a random walk with drift, as it has improved steadily with technological improvements and policy measures.
The overall model is formulated as a Bayesian hierarchical model and estimated using Markov chain Monte Carlo. It is described in detail by Raftery et al.1, who estimated it based on data from 1960 to 2010. Here we update the data to 2015. Raftery et al.1 reported an extensive out-of-sample predictive validation study, which showed that the model provided accurate point forecasts and well-calibrated interval forecasts of population, GDP, carbon intensity, and carbon emissions both for individual countries and at more aggregated levels.
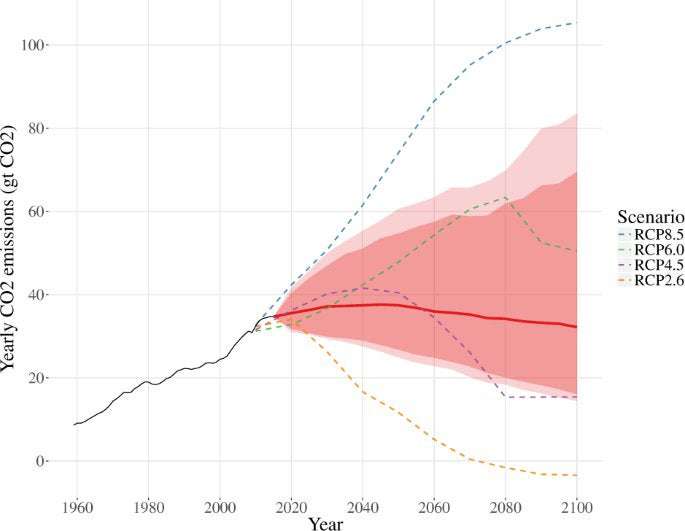
With the updated data, the resulting forecast of global CO 2 emissions is shown in Fig. 1, along with the forecasts from the IPCC’s four main deterministic scenarios, or representative concentration pathways (RCPs)3. We produced our forecast by combining the probabilistic forecasts of population, GDP per capita and carbon intensity, allowing for correlations between them, following Raftery et al.1. Adding the additional 5 years of population, economic and emissions data led to a decline in the median forecast for global annual emissions in 2100 to 34 Gt CO 2 , or 8 Gt CO 2 t lower than the previous forecast1. This reflects slower growth in emissions in 2010–2015 than before 2010.
Fig. 1: Updated probabilistic forecast of CO 2 Emissions, based on data to 2015 and the method of Raftery et al.1. The forecast median of yearly global emissions in 2100 is now 34 Giga tons. Full size image
Figure 2a shows the updated probabilistic forecast of global mean temperature increase from 2015 to 2100 based on current trends. The median forecast for 2100 is 2.8 °C, with likely range (90% prediction interval) [2.1, 3.9] °C. The median is 0.4 °C lower than that of Raftery et al.1, the upper bound is 1.0 °C lower, while the lower bound is 0.1 °C higher. The tighter interval reflects the additional 5 years of data and the improved model.
Fig. 2: Probabilistic global temperature forecast and validation. a (left) Probabilistic forecast of the global temperature anomaly to 2100. The black curve represents the historical HadCRUT4 observations, while the red curve and the shaded area represent the forecast median, 90 and 95% prediction interval. Here anomaly stands for the difference between global mean temperature and the pre-industrial level, which is taken as the average global mean temperature between 1860 and 1880. b (right) Out of sample validation. The black line is the historical anomaly observed from the HadCRUT4 database for 1960–2005. The red curve is the forecasted median, and the dark and light shaded areas represents the 50% and 90% predictive intervals for 2006–2015. The blue curve is the observed anomaly in 2006–2015. The observations fall well within the predictive distribution. Full size image
The previous work showed that the carbon emissions forecasting model validated well in terms of out-of-sample forecasts1. It remains to assess the improved temperature forecasting model. Figure 2b shows the results of a model validation exercise, in which probabilistic forecasts of global temperature were produced for 2006–2015 using data from 1960 to 2005, and compared with what actually happened. The observations fitted comfortably within the prediction intervals.
A major component of the Paris Agreement is the NDCs, that were committed to by 185 of the 197 signatory countries5. A further 12 countries, such as the Philippines, submitted their Intended National Determined Contributions(INDCs), but have not yet formally ratified the Paris Agreement, and so they have not yet submitted NDCs. For these countries, we have taken their NDCs to be the same as their INDCs. We excluded 50 of the 197 countries from our analysis because their promises of cuts in carbon emissions or intensity were unclear. For example, the United Arab Emirates promised to increase the share of “clean energy” in the energy mix to 24% by 2021, but it is unclear how that would actually affect their carbon emissions. For these countries, we assume that they will follow their current trend and we keep the probabilistic forecast of CO 2 emissions following the current trend without further emissions reductions.
Of the remaining 147 countries, 81, including 28 then combined as the European Union (including the UK), promised either direct reductions in emissions, like the USA, or cuts in carbon intensity, like China. The remaining 66 countries promised emissions cuts relative to the Business As Usual (BAU) scenario; in practice this often means limiting the increase in emissions rather than decreasing them. The BAU scenario assumes essentially that GDP per capita will continue to grow at assumed rates, but that carbon intensity will stay constant. For example, Afghanistan reported its emissions as 28.8 Mt of CO 2 equivalent in 2005 and forecast its emissions to be 35.5 and 48.9 Mt in 2020 and 2030, respectively under the BAU scenario. It committed to a reduction of 13.6% relative to BAU for the year 2030, corresponding to 42.7 Mt, an increase of 20% over 2020. Some countries promised a reduction within a specified range, and for these, we took the lower bound reduction as their commitment. Most of the NDCs have 2030 as their target date, but some, such as the USA and Brazil, refer to 2025.
For these 147 countries, we translated the NDCs to CO 2 emissions using the following steps. For countries such as China that promised reductions in greenhouse gas intensity, rather than in total emissions, we interpret this as promising the same percentage reduction in fossil fuels and industry CO 2 intensity. For China, this means reducing emissions by 60% from 2005 to 2030. For countries promising reductions in total greenhouse gas emissions directly, such as the USA, we interpret their NDC as a commitment to the same percentage reduction in CO 2 emissions. In the case of the USA, this is a 26% reduction from 2005 levels by 2025.
For countries promising emissions reductions compared to business-as-usual scenarios, we compare the promised emissions levels with the reference year emissions levels (usually total GHG emissions). We then assume that countries are promising the same proportional reduction in fossil fuels and industry CO 2 emissions. For example, Vietnam promised an 8% reduction in emissions by 2030, compared to a business-as-usual scenario. According to Vietnam’s NDC11, Vietnam’s total GHG emissions in 2010 were 246.8 million tCO 2e , and the projected emissions in 2030 are 787.4 million tCO 2e under the BAU scenario. This means that Vietnam promised to limit its emissions in 2030 to no more than 293.5% of the 2010 level. We thus assume that Vietnam promised to limit fossil fuel and industry CO 2 emissions to 293.5% of the 2010 level by 2030.
We should point out that most countries have committed to cut total GHG emissions in their NDCs, but here we focus on CO 2 emissions and exclude land use emissions. The reason for doing so is two-fold. First, the data for fossil fuels and industry CO 2 emissions are more robust and comparable across countries. More importantly, there is a strong relationship between cumulative fossil fuels CO 2 emissions and the resulting global mean temperature3. For most climate models, cumulative fossil fuels emissions explain more than 95% of the variance in global mean temperature changes (Table 2). We do not explicitly model non-CO 2 forcing agents, but the very high predictive ability of CO 2 emissions alone implies that doing so would not greatly change or improve forecasts.
We first address the question, what is the probability that each country will meet its NDC, given current trends? This probability is shown in Fig. 312. Given current trends, the probabilities are low for most of the major emitters, such as the USA (2%), China (16%) and Japan (10%), Germany (13%) and France (2%). For a few countries, however, such as Russia (93%), they are much higher.
Fig. 3: Probability that countries achieve their Paris Agreement Goals according to their nationally determined contributions (NDCs). a (left) All countries. b (right) European countries. The probabilities vary widely between countries, from values near 0 to values near 1. However, the probabilities are low for most major emitters (USA, China, European Union, Japan). Full size image
Next we ask, what is the probability that warming will be kept to 2 °C if all countries do meet their NDCs? The NDCs generally refer to 2030, with a few countries referring to 2025, while the Paris Agreement target relates to 2100. Thus the answer to the question depends crucially on what happens after the NDCs are met, i.e., between 2030 (or 2025) and 2100. We consider two scenarios for this. In one scenario, which we call the “Adjusted” scenario, countries revert to their pre-2015 trend after the NDCs are met, in most cases improving their carbon intensity, but at a slower pace than between 2015 and 2030. In the other scenario, which we call the “Continued” scenario, countries continue to improve their carbon intensity at the same rate after they meet the NDC until 2100. Figure 4 shows these emissions scenarios for the top two emitters, USA and China.
Fig. 4: Emissions forecasts for the two largest emitters, under three scenarios. “None” (left), which is the continuation of current trends, “Adjusted” (middle), which assumes that countries will meet their Paris Agreement NDCs, but that these policies will not be continued thereafter, and “Continued” (right), meaning that the policies will continue past the NDC target data (2025 for the USA, 2030 for China). Top: USA: the NDC for the USA is in terms of total emissions, and so the forecast is shown in terms of total emissions. The blue dots represent the NDC target, which is 26% less than yearly emissions in 2005. Bottom: China: the NDC for China is in terms of carbon intensity, and so the forecast of carbon intensity is shown. The blue dots represent the NDC target, which is 60% less than the intensity in 2005. In all the plots, the solid red line is the median forecast, the solid pink shaded area is the likely range, or 90% prediction interval, and the light pink shaded area is the 95% prediction interval. Full size image
In 2017, President Trump announced that the USA would withdraw from the Paris Agreement, and it did so in 2020, although President Biden has stated that it will rejoin. Given that US participation in the Paris Agreement remains contested, it remains of interest to assess the consequences of its not participating. We, therefore, consider a fourth scenario, under which the USA does not meet its NDC and continues emissions in line with current trends, while all other countries make additional efforts and meet their NDCs. The probabilistic forecasts of global mean temperature under all four scenarios are shown in Fig. 5.
Fig. 5: Global mean temperature forecast under different scenarios. The “None”, “Adjusted” and “Continued” scenarios are defined as in Fig. 4. The “USA Excluded'' scenarios assumes that all countries except the USA meet their NDCs and continue to reduce carbon emissions at the same rate thereafter, while the USA makes no additional effort and emissions follow their current trend. The purple line is the median forecast, while the shaded area is the likely range (90% prediction interval). Full size image
We find that on current trends, but without additional efforts to meet the NDCs, the median forecast of global mean temperature increase is 2.8 °C, with likely range (90% prediction interval) [2.1, 3.9] °C. If all countries meet their NDCs, but revert to current trends thereafter, the median forecast declines by 0.2 °C to 2.6 °C, with likely range [2.0, 3.4] °C. If all countries meet their NDCs and continue to reduce carbon emissions at the same rate thereafter, the median forecast declines by a further 0.3 °C, to 2.3 °C, with likely range [1.8, 2.9] °C. The probability of staying below 2 °C is 5% under the “None” scenario, 12% under the “Ajusted” scenario, and 26% under the “Continued” scenario.
If the USA continues on its current trend rather than meeting its NDC, the median forecast of cumulative global carbon emissions would be about 10% (220 Gt CO 2 ) higher than under the “Continued” scenario. The median temperature forecast would then rise to 2.4 °C with likely range [1.9, 3.1] °C, and the probability of staying below 2 °C would go down from 26% to 18%. Under all the scenarios, the probability of staying below 1.5 °C is less than 2%.
Our results suggest that even if all countries meet their promises under the Paris Agreement and continue to reduce emissions at the same rate thereafter, it is unlikely that warming would stay under 2 °C, a conclusion also reached by other authors using different approaches13,14. We, therefore, ask more precisely, what further reductions would be needed to ensure this? Or, to put it another way, by how much would the emissions reductions promised in the NDCs need to be increased?
Our median forecast of cumulative carbon emissions by 2100 (from 2015) is 3108 Gt CO 2 without the Paris Agreement, and 2083 Gt CO 2 under the “Continued” scenario. We find that to have a 50% chance of limiting warming to 2 °C, cumulative emissions would need to be reduced further to 1579 Gt CO 2 . Assuming a constant rate of annual decline in global emissions, this would require that the annual rate of decline would need to be 1% to reach the NDCs, and 1.8% to have a 50% chance of staying under 2 °C.
While the average rate of decline would need to increase by 80%, this does not mean that the NDCs would need to increase by as much. The needed increase in the NDCs would vary by country, depending on their promises and progress to date. For the largest emitters, the needed increases in the NDCs would be 7% for China, 38% for the USA, 55% for India, 49% for Japan, and 25% for Germany; see Table 1 for more detail. This implies that China needs to increase its 60% carbon intensity cut target to 64%, while the USA needs to increase its 26% emissions cut target to 36%.
Table 1 Percent increase in emissions reductions relative to the NDCs needed to achieve different objectives in the Paris Agreement for top emitting countries. Full size table
Note that to have an even chance of limiting global warming to 2 °C would require global progress towards net zero fossil fuels and industry emissions, but it would not require global annual emissions to reach net zero before 2100, although it would likely involve individual countries doing so. Under this scenario, emissions would need to decline by about 80% relative to their median forecast in the absence of additional efforts (which is roughly equal to the current level), giving global annual emissions of about 7.8 Gt CO 2 by 2100.
Similar calculations indicate that to make it likely (90% probability) to stay below 2 °C of warming by 2100, rather than just an even chance, would require more than quadrupling the annual rate of decline in emissions. This would require reaching close to global net zero emissions (10% of the current level) by 2070. Many individual countries would need to reach net zero CO 2 emissions earlier to achieve this goal.
To have an even chance of staying below 1.5 °C would require multiplying the annual rate of decline by about 8, reaching close to global net zero emissions by 2045. To make it likely (90% probability) to stay below 1.5 °C would require multiplying the annual rate of decline by almost 30, and reaching close to global net zero by 2023. It is not too surprising that staying below 1.5 °C would be so difficult, given that there is already estimated committed warming of 1.1 °C15,16,17,18.
The 2018 IPCC report on mitigation pathways compatible with staying below 1.5 °C has also addressed the question of how this can be done19. They used the same general framework as the IPCC 2014 AR5 report3, basing results on scenarios for future socioeconomic and energy intensity outcomes, combined with ensembles of climate models to translate these into climate outcomes, rather than the fully statistical probabilistic framework we use here. Nevertheless, our results are broadly in line with theirs, albeit with some differences.
They conclude, as do we, that even if the NDCs are met and mitigation continues after 2030, global warming is likely to surpass 1.5 °C. They argue that to stay below 2 °C in 2100 with probability 66% would require that total GHG emissions decline by 25% from 2010 to 2030, while our method suggests that a reduction of 31% in fossil fuels and industry CO 2 would be required to achieve the same goal with probability 50%. The interpretations of probability are different, as theirs are based on ensembles of scenarios and our method produces calibrated probability distributions, but the results are similar. They also conclude that to achieve this would require net zero emissions by 2070. Our method suggests that it would require a 66% reduction in emissions from 2010 to 2070, and that this goal could be achieved without reaching net zero globally. This would, however, require sustained emissions reduction throughout the century, and would require close to net zero emissions to be reached in many countries to achieve the large global total emissions reductions needed.
They conclude that to stay below 1.5 °C would require a 45% reduction in emissions from 2010 to 2030, reaching net zero emissions globally by 2050. Our method suggests that this would require an even larger reduction of around 80%, reaching close to net zero emissions by 2045. Again, the results are qualitatively similar.
TiagoTiagoT on February 11st, 2021 at 03:22 UTC »
I remember a time when we were worried there was a risk that we would cross the 1 degree threshold and that was already a pretty dreadful threat...
Earth_Is_Getting_Hot on February 11st, 2021 at 00:50 UTC »
We really need a radical departure. Not sure what its going to take for collective action. The moon mission gave us a picture of Earth, alone in space, and triggered a massive movement to protect our environment. What is our moon mission today?
The_God_of_Abraham on February 10th, 2021 at 21:04 UTC »
Worth pointing out that most countries aren't meeting their goals in the first place so discussing the effect of hitting target goals is largely irrelevant.