A Polar Vortex collapse sequence has begun in late December 2020, with a major Sudden Stratospheric Warming event on January 5th, 2021. We will look at the sequence of these events, and how they can change the weather in Europe and the United States in the coming weeks.
The main “player” in these weather events, is of course the Polar Vortex. It connects the bottom of the atmosphere (our weather) with the stratosphere above it. A strong exchange of energy between these two layers can heavily disrupt the weather development across the Northern Hemisphere.
Since knowledge is the key, we will do a quick recap of what exactly is the Polar Vortex.
All of the clouds (and the weather that we feel) are found in the lowest part of the atmosphere called the troposphere. It reaches up to around 8 km (5 miles) altitude over the polar regions and up to around 14-16 km (9-10 miles) over the tropics.
Above it, there is a much deeper layer called the stratosphere. This layer is around 30 km thick and is very dry. We can see the layers of the atmosphere on the image below, with the stratosphere in green hues, and the troposphere in blue at the bottom.
Every year as we head into autumn, the north pole starts to cool. But the atmosphere further south is still relatively warm as it is still receiving energy from the Sun. The north pole receives very little sunlight and thermal energy, cooling at a faster rate.
The reduction in temperature also means a gradual pressure drop over the north pole. In the stratosphere, the process is the same. As the temperature drops over the pole and the temperature difference towards the south increases, a low-pressure area starts to develop across the stratosphere.
The image below shows a typical example of the Polar Vortex at around 30km altitude (10mb level) in the middle stratosphere.
It is almost like a very large cyclone, covering the whole north pole, down to the mid-latitudes. The polar vortex is present at all levels, almost from the ground up. The image below shows the polar vortex at different altitudes. The closer to the ground we get, the more deformed it gets, due to the complex terrain and the many weather fronts and systems.
We produced a high-resolution video for you below, which very nicely shows the Polar Vortex spinning over the Northern Hemisphere. It covers the period from December 2020 to January 2021, made from NASA GEOS-5 data.
Video shows the 10mb level (30km altitude) potential vorticity parameter, which overly simplified means, that it shows the energy of the polar vortex. Be aware of how the energy is being taken away from the polar vortex by the invisible polar Anticyclones (having a different kind of power), spinning in the opposite direction.
As a general reference, we usually look at the polar vortex in the stratosphere at the 10mb level. That is around 28-32km (17-20 miles) altitude. This is considered to be around the middle stratosphere, and thus a good representation of the general dynamics of the polar vortex.
The strength of the polar vortex is most often measured by the power of the winds inside it. Usually, this is done is by measuring the zonal (west to east) wind speeds around the polar circle (60°N latitude).
Below we have an analysis from the NASA monitoring system, where we can see a very interesting progression. In early December, the polar vortex was at a quite strong level, reaching 40m/s zonal wind speeds. Problems began towards the mid-month, and especially towards late December when the stratospheric warming began. All graphics below are at the 10mb level (~30km altitude).
Below is an image from the video we showed you earlier in the article, and it shows a quite healthy polar vortex in early December. It has a nice shape and a healthy spinning core.
Towards mid-December, the pressure from the North Pacific was rising, with an Anticyclonic presence there gaining strength. The anticyclonic circulation was slowly getting stronger, starting to drain some energy away from the polar vortex, and changing its shape.
By late December, the Pacific/East Asian Anticyclone became quite a force, now draining a lot of energy from the Polar Vortex and actually becoming visible.
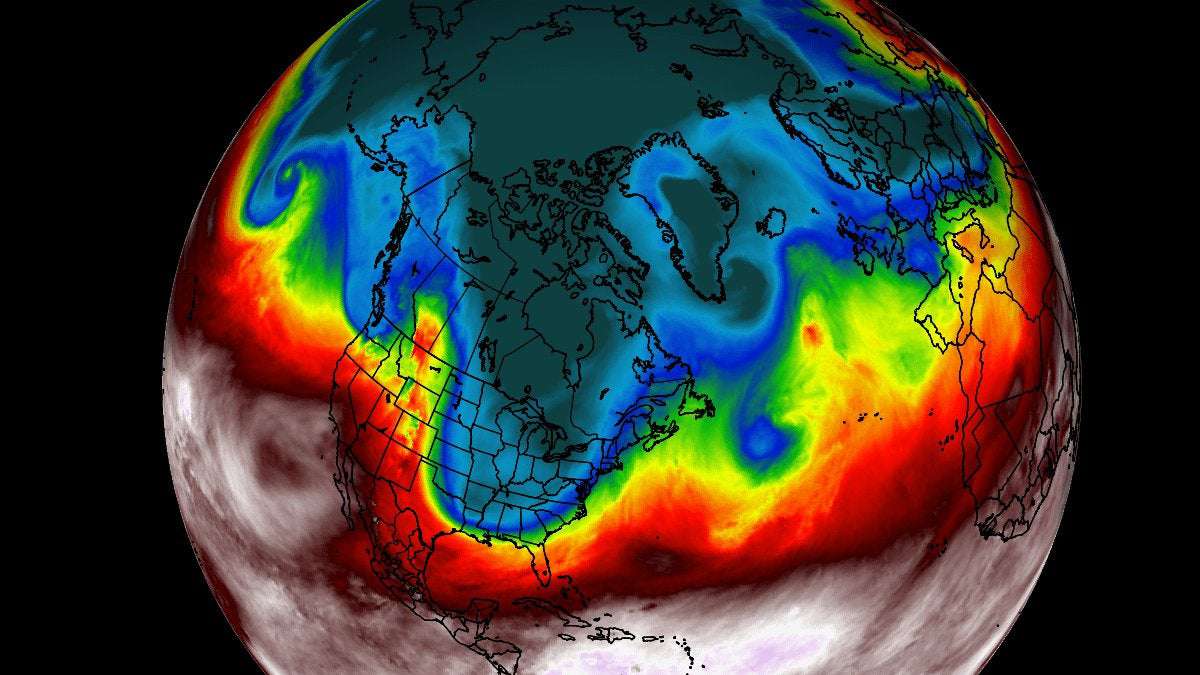
At a similar time in late December, a warming sequence began, from Europe over into central Asia. It was starting to engulf the outside layers of the polar vortex. The cold-core of the polar vortex is still rather intact at this point, holding temperatures colder than -80°C in the center over Greenland.
Just two days later, the warming wave reached a local peak over Siberia, with maximum temperatures in the wave reaching up to +5°C or higher.
On January 5th, the preliminary date of the Sudden Stratospheric Warming event was marked, as the winds around the polar circle have reversed. We can see how massive and strong the Anticyclone has now become, pushing strongly against the polar vortex (bright white). Together with the warming wave, the strong Anticyclonic system has deformed the once circular polar vortex into a banana-shaped feature.
The warming wave has crawled over the entire North Pole in the stratosphere, effectively splitting the cold-core of the polar vortex into two parts. One over North America and one over the European sector. At this point, this does not have much to do directly with the weather on the surface, as it is at 30km altitude, but we will get to weather effects soon.
Looking quickly at the forecast, we can see that the stratospheric Anticyclone will hold stable and move further over the North Pole. It will continue pushing against the very broken polar vortex.
At this point, a new warming wave is also forecasted to start, which should temporarily prevent any quick reorganization and strengthening of the stratospheric circulation.
Taking a look at the NASA temperature analysis for the stratosphere, we can see the large temperature spike at the 10mb (30km) level, which is in the middle stratosphere. The second image shows the temperature analysis in the lower stratosphere at 50mb (20km) level, also having a very clear temperature spike.
Looking even lower, we have the 150mb level, which is kinda the boundary or the “buffer zone” between the stratosphere and the troposphere. Here we can also see the temperature spike, meaning the warming event was fairly robust and fast.
Before looking closer at the weather forecasts and their relation to the polar vortex, we need to look at some historic examples of similar events. History can sometimes be the best teacher for the future, and in science, this can be true more often than not.
Below we have 2 images, which both are quite simple to read and understand. They show time from left to right, and altitude from bottom to top. Colors show the temperature anomaly, with red being warmer than normal and blue was colder than normal. We can nicely track the progress of stratospheric warming events over time and altitude.
We can see the progression of warming from the top of the stratosphere, going downwards over time. The first image shows the 2004 stratospheric warming event and the second graphic shows the 2013 event.
The important takeaway is that the warming progresses quite fast down into the troposphere and can start to quickly affect our weather. But it usually stops around 100mb or 150mb level (12-15km). That is normal, due to the fact that we can see a lot of strong weather systems in our troposphere, which can in some cases deflect/reverse any incoming effects from the stratosphere.
Below we have similar two images, but with pressure anomalies instead of temperature. But here you can actually see the connecting points between high pressure coming downwards and the surface layer in the polar region. In both cases, the final effect was seen as individual connections to the bottom levels over time, interfering with the weather development. This indicates that the influence from the Polar Vortex collapse events is periodically interfering with the weather development on a sub-seasonal scale, kinda like waving or resonating.
We don’t yet have the same graphic for 2021, for obvious reasons, since we still need more data to be gathered. But we can look at the forecast data in a similar image below.
What we are seeing is a very similar pattern as in 2004 and 2013. The negative values in this image represent higher pressure. So we can see the descending high-pressure, making individual contacts with the lower layers. This means that the influence is not a constant every time, but rather periodic.
We also decided to look at the weather patterns prior to the 2004 and 2013 events. And we can see in the images below. We can see on the first image for 2004, that the pattern was already positioned for colder weather over Europe, thanks to the strong high-pressure system in the North Atlantic. The United States was generally milder, with southerly flow dominating much of the CONUS.
In 2013, the picture was kinda the opposite. The pattern over the United States was generally colder than in 2004, while Europe was mild to warm even at this point.
This winter, the pattern is kinda a combination of both. We have another cooler/colder episode over Europe like in 2004, thanks to the high-pressure systems in the North Atlantic. At the same time, we also heed a few decent cold episodes over the United States as well.
But after the Polar Vortex breakdown and the stratospheric warming event, the pressure patterns changed quite importantly in 2004 and also in 2013. The image below is the pressure pattern one month after the Polar Vortex collapse in 2004. The strong high pressure in the North Atlantic has been replaced by a strong deep low-pressure system, and the high-pressure has moved into the Arctic regions. A dramatically different pattern than before the Polar Vortex collapse.
Looking at the month after the 2013 Polar Vortex collapse, we also see a reverse pattern. A strong high-pressure system is over the Arctic Ocean, with the low-pressure system s being displaced into Europe and central Canada.
More importantly, we have to look at the temperatures 0-30 days after the Polar Vortex collapse. We can see the weather has completely changed. In 2004, we now see colder air dominating most of Canada and the eastern United States. Over Europe, we have milder and warmer than normal temperatures, while the north and east/central Europe is mostly colder than normal. The biggest weather change here was seen in the United States.
0-30 days after the Polar Vortex breakdown in 2013, temperatures have dropped over much of Europe, along with an increased snowfall going even into the Spring season. In North America, the colder air was kept mostly in central Canada, with warmer than normal temperatures over the eastern and southern United States. Some colder than normal temperatures were recorded in the western United States.
All in all, these two examples nicely show us how the weather pattern almost completely reversed after the Polar Vortex collapse. Places that were cold before, were then colder, and places that were warmer before, got winter weather. This is not a strict rule, as every such event is a unique case. But in most cases, some effects were observed.
But there were Polar Vortex collapse events, that have produced no detectable effects on the weather. Usually, that is because the effects were either too weak or did not reach down far enough. The effects down from the stratosphere can also be deflected or “denied” if the existing pressure patterns are already very strong and sturdy and forced, not allowing such external interference from the stratosphere.
WEATHER FORECAST AFTER THE POLAR VORTEX COLLAPSE
We have now seen the changes that have happened after the stratospheric warming events in 2013 and 2004. But what can we expect from our current Polar Vortex breakdown event in 2021?
Looking 10 days ahead, we can already see a pretty wintery pattern. A strong high-pressure blocking system over Greenland appears around this time. It could be related to the stratospheric events, but further analysis will have to confirm a direct or indirect relation to it.
Such a strong blocking of course means lower pressure in the eastern United States and over the Siberian sector and Europe. We can see a negative anomaly extending towards Europe, imply a likely corridor for colder air transport, in a quasi cross-polar flow.
Temperature anomalies also show a quite phenomenal winter pattern. Displaced by the high pressure over the Arctic regions, the cold air sweeps down into the central and eastern United States. We can also see a large area of colder than normal temperatures extending from the Siberian sector all the way into western Europe.
This will be one to look out for, as these cold air outbreaks from the east can sometimes get quite intense with lots of snowfall if moisture is involved or mixing with warmer air. In Europe and especially in the British Isles, these cold air outbreaks are well known as “the beast from the east”.
We produced a snow depth change forecast, which shows the snow depth change in the next 10 days, till January 19th. We can see clearly that most of the western and northwestern United States will see some melting of the snow cover, where it is present, also in the Midwest. Parts of the northeastern United States will see some snow depth/cover advance, as in the northern and eastern Canada.
Over Europe, we can see a pretty significant snow depth advance in the next 10 days, especially over Scandinavia, eastern Europe, and the Balkan highlands. Some snow depth reduction is seen over Spain and the British Isles since the current snowpack will not hold for that long.
But when we look at the snow depth change from day 10 to day 16, we can see a pretty big change, especially over the United States. A snow depth/cover is forecast to expand and advance across much of the northeastern United States and the northwestern United States. Snow cover advance is also forecast for Midwest and also down into the southcentral regions. This is still just a forecast, but the general pattern with the strong blocking over Greenland is generally supportive of this idea.
In Europe, we see some reduction in the snow cover over far eastern parts. But we can see further increase over Scandinavia, and snow cover advance further into central Europe and over the British Isles. This does indicate active cold air transport and the so-called “beast from the east”, at least in some shape or form.
Looking at the pressure pattern forecast at that time, we can see why the snow cover advances over the United States and Europe. We have a triple high-pressure “alliance” around North America. One strong system rising in the North Pacific, one over Beaufort sea and the blocking over Greenland. This in theory supports cold air transport down into the continental United States, enabling the snow cover advance that we have seen in the day 10-16 range.
We also see the contrast strong low-pressure system over Europe, which should transport quite some cold air into the continent. At this range, it is not really possible to say how cold or where exactly this air would go. But such a pattern itself can open the gates to the polar circle and can allow releasing colder air over quite a large continental area.
The temperature forecast below does show this, but we have to consider that this is an ensemble forecast and would be more “spread out” with the colder air since more individual calculations are in this averaged forecast.
Generally, it does show the colder air surrounding Scandinavia, northeastern Europe, and extending towards the British Isles. Central and Western Europe are generally not shown so cold, but this forecast will change in the future in one direction or another.
Places on the border between the colder and warmer air towards the south could see larger amounts of snowfall in these “cold-warm battlezones”, with moisture provided. Historical examples are large snowfall events in the northern and southern Balkans. But we are at this point too far out in the future to discuss any detailed possibilities. Trends matter most at this range, as a lot can change.
Over North America, we can see the active cold air transport from western and central Canada down into central and eastern United States. This supports the idea of the snow cover advance across much of the continental United States, and even into south-central parts if this forecast idea persists.
Looking at the final week of January, the pattern still holds to a large degree. The main difference is over North America, with the receding of the lower pressure area further north into western Canada.
Over Europe, we still have the low-pressure anomaly present over much of the continent.
Temperature anomalies still indicate the transport of colder air from western Canada, but not so far south anymore, as the low-pressure system has moved further north. This would still mean colder air for the northwestern United States, the Midwest, and the parts of the northeast.
Over Europe, the colder air anomaly is still present, and will likely remain as long as the Greenland high-pressure system remains in place, holding the lower pressure in the circulation over Europe.
Such cold weather is never a guarantee with any Polar Vortex collapse event, and this year, it is no different. Currently, the forecast trends are looking good for some proper winter dynamics across North America and Europe. Caution is always advised, as we are only interpreting the forecasts that we have, which is no guarantee that it will develop in that way.
Many other models are also available, and each model can have its own idea of how the weather can develop in this Polar Vortex situation. If we added all the different models to this article, it would be even more preposterously long. But we decided to use the GEFS model, as it currently shows a more classical weather response to the Polar Vortex collapse and serves as a good example.
We will keep you updated as fresh data is available, and more reliable forecasts are released. So stay tuned, and don’t forget to bookmark our page to have all the info at hand!
Winter storm watch for Texas as snow is forecast to spread towards the lower Mississippi valley tonight through Monday, then heads for the Southeast United States
North Pacific now in double trouble as another storm from the Aleutians joins the extratropical storm over the Gulf of Alaska, windstorm heads for the coast tonight
mrblahblahblah on January 10th, 2021 at 05:55 UTC »
I remember when we first got the vortex in the Northeast US
Fox news kept saying how it was normal and happened every 15 to 20 years
it's happened every year since
greenteaicedtea on January 10th, 2021 at 05:18 UTC »
I live in Canada and where I live it should be in the double negatives at night but it’s not. It’s been so mild that I’m barley bundling up and I can do outdoor tasks in just a long sleeve shirt some days.
S_204 on January 10th, 2021 at 04:21 UTC »
It's been the warmest December and start of January in my life.... I live in Winnipeg, a city notorious for its frigid winters. We're barely below freezing right now. Shits weird man. I don't want it to be colder... But it should really be colder right now.