Between 26 of February and 1 July 2020, there were a total of 1178 laboratory-confirmed cases and a further 350 probable cases of SARS-CoV-2 in New Zealand. A ‘probable case’ means a person who has been classified as such by the medical officer of health based on exposure history and clinical symptoms, and who has either returned a negative laboratory result or could not be tested. Of these combined laboratory-confirmed and probable cases, 55% were female and 45% were male, with the highest proportion of cases in the 20–29 age group (Table 1). Many cases were linked to overseas travel (37%). Geographic locations in New Zealand with the highest number of reported cases did not necessarily reflect the human population size or density in that region, with the highest incidence reported in the Southern District Health Board (DHB) region rather than in highly populated cities (Fig. 1). The number of laboratory-confirmed cases peaked on 26 March 2020, the day after New Zealand instigated an Alert Level 4 lockdown—the most stringent level, ceasing all non-essential services and stipulating that the entire population self-isolate (Fig. 1; see ref. 16 for a summary of New Zealand’s COVID-19 alert levels). From 23 May 2020, New Zealand experienced 25 consecutive days with no new reported cases until 16 June, when new infections, linked to overseas travel, were diagnosed. All subsequent new cases have been from patients in managed quarantine facilities.
Table 1 Demographics of COVID-19 cases in New Zealand. Full size table
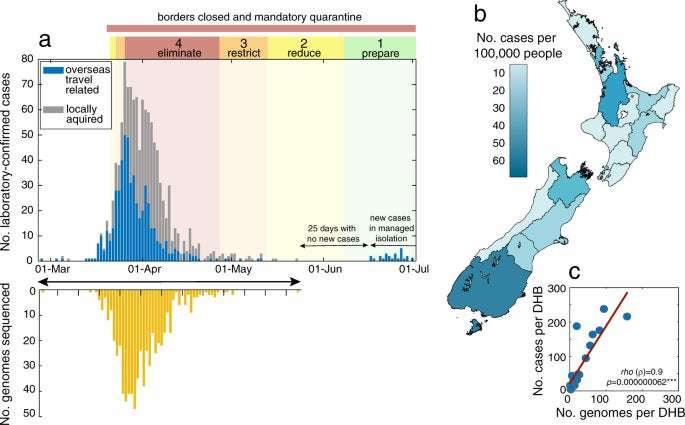
Fig. 1: Number and distribution of cases and genomes. a Number of laboratory-confirmed cases by reported date, both locally acquired (grey) and linked to overseas travel (blue) in New Zealand, highlighting the timing of public health alert levels 1–4 (‘eliminate’, ‘restrict’, ‘reduce’, ‘prepare’) and national border closures. The number of genomes sequenced in this study is shown over time in yellow. b Map of New Zealand’s District Health Boards shaded by the incidence of laboratory-confirmed cases of COVID-19 per 100,000 people, as defined by the colour-bar. c Number of laboratory-confirmed cases per District Health Board (DHB) versus the number of genomes sequenced, indicating Spearman’s rho (ρ), where asterisks indicate statistical significance (p = 0.000000062). Full size image
We sequenced a total of 649 virus genomes from samples taken between 26 February (first reported case) and 22 May 2020 (the last confirmed case that was not associated with managed quarantine facilities during the sampling time period). This represented 56% of all New Zealand’s confirmed cases. The data generated originated from the 20 DHBs from across New Zealand. DHBs submitted between 0.1 and 81% of their positive samples to the Institute of Environmental Science and Research (ESR), Wellington, for sequencing. Despite this disparity, a strong nationwide spatial representation was achieved (Fig. 1).
Notably, the genomic diversity of SARS-CoV-2 sequences sampled in New Zealand represented nearly all of the genomic diversity present in the global viral population, with nine second-level A and B lineages from a proposed global SARS-CoV-2 genomic nomenclature17 identified. This high degree of genomic diversity was observed throughout the country (Fig. 2). The SARS-CoV-2 genomes sampled in New Zealand comprised 24% aspartic acid (SD614) and 73% glycine (SG614) at residue 614 in the spike protein (Fig. 2). Preliminary studies suggest that the D614G mutation can enhance viral infectivity in cell culture18 and phylodynamic approaches have shown an increase in growth and size of lineages with this mutation19. Nevertheless, it is noteworthy that the increase in glycine in New Zealand samples is due to multiple importation events of this variant rather than selection for this mutation within New Zealand. We also inferred a weak yet significant temporal signal in the data, reflecting the low mutation rate of SARS-CoV-2, which is consistent with findings reported elsewhere (Fig. 2).
Fig. 2: Genomic diversity of SARS-CoV-2 in New Zealand. a Root-to-tip regression analysis of New Zealand (blue) and global (grey) SARS-CoV-2 sequences, with the determination coefficient, r2 (an asterisk indicates statistical significance; p = 0.049). b Maximum-likelihood time-scaled phylogenetic analysis of 649 viruses sampled from New Zealand (coloured circles) on a background of 1000 randomly subsampled viruses from the globally available data (grey circles). Viruses sampled from New Zealand are colour-coded according to their genomic lineage16 as labelled in c. c The number of SARS-CoV-2 genomes sampled in New Zealand within each lineage16. d The sampling location and proportion of SARS-CoV-2 genomes sampled from each viral genomic lineage is shown on the map of New Zealand. e The frequency of D (blue) and G (red) amino acids at residue 614 on the spike protein over time. Full size image
Despite the small size of the New Zealand outbreak, there were 277 separate introductions of the virus out of the 649 cases considered. Of these, we estimated that 24% (95% CI: 23–30) led to only one other secondary case (i.e. singleton) while just 19% (95% CI: 15–20) of these introduced cases led to ongoing transmission, forming a transmission lineage (i.e. onward transmission to more than one individual; Fig. 3). The remainder (57%) did not lead to a transmission event. New Zealand transmission lineages most often originated in North America, rather than in Asia where the virus first emerged, likely reflecting the high prevalence of the virus in North America during the sampling period. By examining the time of the most recent common ancestor, or TMRCA, of the samples, we found no evidence that the virus was circulating in New Zealand before the first reported case on 26 February. Finally, we found that detection was more efficient (i.e. fewer cases were missed) later in the epidemic in that the detection lag (the duration of time from the first inferred transmission event to the first detected case) declined with the age of transmission lineages (as measured by the time between the present and the TMRCA; Fig. 3).
Fig. 3: Genomic transmission lineages of SARS-CoV-2 in New Zealand. a Frequency of transmission lineage size. b The number of samples in each transmission lineage as a function of the date at which the transmission lineage was sampled, coloured by the likely origin of each lineage (inferred from epidemiological data). Importation events that led to only one additional case (singletons) are shown in grey over time. c Frequency of TMRCA (the time of the most recent common ancestor) of importation events over time. d The difference between the TMRCA and the date as which a transmission lineage was detected (i.e. detection lag) as a function of TMRCA. Spearman’s rho (ρ) indicates a significant negative relationship (p = 0.00012). Full size image
The largest clusters in New Zealand were often associated with social gatherings such as weddings, hospitality and conferences20. The largest cluster identified during the sampling time, which comprised lineage B.1.26, most likely originated in the USA according to epidemiological data, and significant local transmission in New Zealand was probably initiated by a super spreading event at a wedding in Southern DHB (geographically the most southern DHB) prior to lockdown. Examining the rate of transmission of this cluster enables us to quantify the effectiveness of the lockdown. Its effective reproductive number, R e , decreased over time from 7 at the beginning of the outbreak (95% credible interval, CI: 3.7–10.7) to 0.2 (95% CI: 0.1–0.4) by the end of March (Fig. 4). The sampling proportion of this cluster, a key parameter of the model, had a mean of 0.75 (95% CI: 0.4–1), suggesting sequencing captured the majority of cases in this outbreak. In addition, analysis of genomic data has linked five additional cases to this cluster that were not identified in the initial epidemiological investigation, highlighting the added value of genomic analysis. This cluster, seeded by a single-super spreading event that resulted in New Zealand’s largest chain of transmission, illustrates the link between micro-scale transmission to nationwide spread (Fig. 4).
Fig. 4: Estimates of the effective reproductive number, R e , through time. Maximum clade credibility phylogenetic tree of New Zealand’s largest cluster with an infection that most likely originated in the USA. Estimates of the effective reproductive number, R e , are shown in violin plots superimposed onto the tree, grouping the New Zealand samples into two time-intervals as determined by the model. Black horizontal lines indicate the mean R e . Tips are coloured by the reporting District Health Board and their location shown on the map. Full size image
Aeonera on January 4th, 2021 at 03:47 UTC »
Something people overlook is that our lockdown could only work do to robust social security systems which enabled our government to giving out money to keep people and companies afloat during it.
Without those systems this wouldn't have been possible at all. this isn't something that could be done by anywhere at a moments notice, you need the social infrastructure there in the first place.
fizzunk on January 4th, 2021 at 02:50 UTC »
Japan was almost there. EDIT: Japan was looking good for a while. (I realize ‘almost there’ was too strong an expression.
Soft lockdowns, companies going online, short closure of schools, constant media attention and a one time stimulus check to help people suffering.
In July there were single digit cases on Corona in Tokyo, one of the most densely populated cities in the world with people cramming into trains like sardines everyday. For a while I honesty believed a soft lockdown was more effective than a total lockdown like New Zealand.
Rather than see things out till the end, our PM decided that we were done and encouraged everyone to travel and eat with discounted coupons nationwide.
We’re now at 230,000 active cases. Second highest in the western pacific area. With another climb in infections expected after the winter vacation.
mypantsareonmyhead on January 3rd, 2021 at 23:46 UTC »
I get told all the time by people overseas, that we're so lucky in New Zealand to have our Prime Minister. She eradicated Covid-19!
No.
It wasn't luck, and it wasn't the PM. It was NEW ZEALANDERS who eradicated Covid-19. The people created the outcome, led by a government who pushed science and facts to the front centre of the stage.