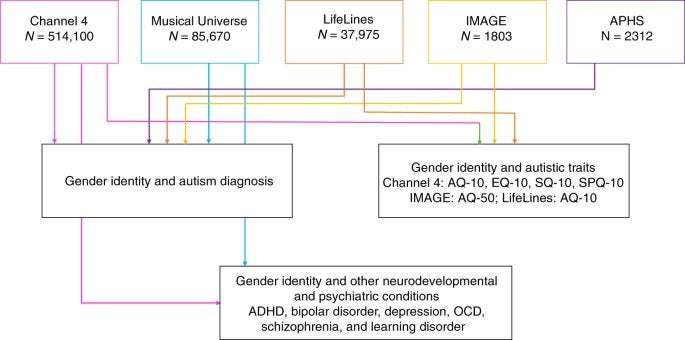
We used five datasets for this study. The largest of these (Channel 4 dataset, C4) consists of N = 514,100 individuals who completed online questionnaires as a part of a UK Channel 4 television program about autism. These participants self-reported their autism diagnosis, and indicated their gender based on three options “Male”, “Female”, and “Transgender”. To address autism-related self-selection bias in this dataset, we used a second dataset (Musical Universe, MU, N = 85,670) recruited through a website for research about musical behavior, personality and cognition. Participants completed information about their autism diagnosis and selected their gender from four options: “Male”, “Female”, “Transgender” and “Other”. However, neither of these two datasets have separately recorded information on sex at birth and gender, and in both datasets, participants were asked to choose their “Sex”, although we acknowledge that the information collected is primarily of gender. To address this, we used two additional datasets where information was collected separately for sex at birth and gender. In the third dataset (APHS, N = 2312), participants were recruited for an internet-based physical health survey. Participants completed information on their autism diagnosis including when they were diagnosed and who diagnosed them, their sex at birth, and their current gender identity. The fourth dataset (IMAGE, N = 1803) consists of participants who were recruited for a genetic study of autism and mathematical ability. Participants completed information on their autism diagnosis, their sex at birth, and their gender. In addition, all autistic participants provided a copy of their diagnostic report to verify their diagnosis. The fifth and final dataset consists of a subset of participants from the LifeLines Cohort and Biobank72 (N = 37,975) who provided information on sex assigned at birth and gender, autism diagnosis, and completed a measure of autistic traits. This dataset consists of individuals who are considerably older than those in the other four datasets, and who were recruited primarily through GP clinics. None of the five datasets were recruited specifically to investigate the association between gender diversity and autism, which limits gender-based self-selection bias.
The Channel 4 dataset (C4 dataset) comprises participants who completed self-report measures as a part of the Channel 4 documentary titled “Are you autistic?”, in Spring 201751. A mobile-friendly website was developed and advertised on the Channel 4 TV website (https://www.channel4.com/). Participants indicated if their results could be used for research purposes. A total of 758,916 entries were recorded. Participants provided information on demographics (gender (see below for details), age, educational attainment, geographical region, handedness, occupation, autism and other neurodevelopmental or psychiatric diagnosis) and completed four self-report measures. Participants who consented to share their data for research were asked: “Have you taken this survey before? To make sure our data are as accurate and as useful as possible please tell us if you’ve taken this survey before.” If participants indicated that they had taken the survey before, they were marked as duplicates. After removing duplicates, we were left with a total of 695,166 participants. We were unable to use IP addresses to identify duplicates due to ethical constraints. We included participants aged 15 to 90 years, in line with previous research51. Participants were asked to indicate their “Sex” using one of four options: “Male”, “Female”, “Transgender” and “Prefer not to say”. Whilst “Sex” was asked in the survey, we recognize that the information provided here is of sex or gender, or both and we refer to this as gender throughout the manuscript. Whilst designing the survey we did not make a distinction between gender and sex as these terms are often used interchangeably in the general population. We further removed individuals who did not provide information on gender (“Prefer not to say”), resulting in N = 675,360 individuals.
During data collection, information on gender was initially collected using four options listed above. However, towards the end of the data collection phase, the “Transgender” option was modified to “Other” to make it more inclusive. For this study, we restricted our analysis to only those participants from the first phase of data collection who could choose from “Male”, “Female”, “Transgender” and “Prefer not to say”, as this makes it clearer for interpreting the data. This resulted in 514,100 individuals whose gender was either “Male” (N = 193,398), “Female” (N = 317,891), or “Transgender” (N = 2811 or 0.55%).
Channel 4: ascertaining diagnosis of autism and other conditions
27,919 participants (5.4%) indicated they had an autism diagnosis (cisgender males = 13,317; cisgender females = 13,934, transgender and gender-diverse = 668). Diagnoses of autism and other psychiatric conditions were asked using the question: “Have you been formally diagnosed with any of the following (please click all that apply?)”. For other psychiatric conditions, participants could choose from ADHD, bipolar disorder, depression, learning disorder, schizophrenia, and OCD. The wording of the question should typically preclude (though not completely eliminate) self-diagnosed individuals. Participants indicated they had the following diagnoses: ADHD (N = 19,300), bipolar disorder (N = 9025), depression (N = 122,829), learning disorder (N = 18,559), OCD (N = 13,115), and schizophrenia (N = 1321). These were not mutually exclusive, as individuals could endorse several diagnoses. In addition, participants provided information on their educational attainment and age (Supplementary Tables S1 and S2).
Channel 4: measures of traits related to autism
All participants completed four short, self-report psychological trait measures: the Autism Spectrum Quotient-10 (AQ-10)73, a widely-used measure of autistic traits; the Empathy Quotient-10 (EQ-10)51, a measure of empathy traits; the Systemizing Quotient-10 (SQ-10)51 (10 items from the Systemizing Quotient–Revised74, but referred to here as Systemizing Quotient-10), a measure of systemizing traits (the drive to analyze or build a system75); and the Sensory Perception Quotient-10 (SPQ-10)51, a measure of sensory sensitivity. Using the SQ-10 and the EQ-10 data, we calculated “Brain Types”51, which refer to an individual’s cognitive profile based on the discrepancy of their scores on empathy and systemizing traits. Individuals may be classified into one of five different “Brain Types” based on the standardized discrepancy between their systemizing and empathy scores51,76.
Musical Universe dataset: overview of dataset
The Musical Universe (MU) dataset consists of a total of 89,218 individuals who completed measures on musical behavior, personality, and cognition, in exchange for feedback about their scores at www.musicaluniverse.org. We identified duplicates first using IP addresses, and then, among individuals with identical IP addresses, using demographic variables—gender (see below for further information about this), age, educational attainment, occupation, and diagnosis. A total of 85,670 unique records were identified. Participants ranged in age from 18 to 88 years old (Supplementary Table S1).
Similar to C4, the MU data collection did not make a clear distinction between gender and sex. Participants were asked for their “Sex” where they could choose one of four options: “Male” (42,291 non-autistic and 666 autistic), “Female” (41,659 non-autistic and 365 autistic), “Transgender” (361), and “Other” (328) (Supplementary Table S1). However, we recognize that participants have actually provided information on their gender and we refer to this as gender throughout the manuscript. In the primary analyses, we combined participants who chose the “Transgender” and “Other” option into the transgender and gender-diverse group (634 non-autistic and 55 autistic individuals) and conducted further sensitivity analyses using only individuals who chose the “Transgender” option. We decided to combine the two groups as some individuals who are transgender and gender-diverse in the broad sense (i.e., their gender is different from their sex assigned at birth) may not identify as transgender and may interpret the term transgender more narrowly (i.e., their binary gender identity is opposite to the binary sex assigned at birth).
Musical Universe: ascertaining diagnosis of autism and other conditions
Participants were asked if they had a formal diagnosis of autism from a professional. This should typically preclude (though not completely eliminate) self-diagnosed autistic individuals from participating. A total of 1,086 participants indicated that they had an autism diagnosis (Supplementary Table S1). In addition, they were asked if they had a formal diagnosis of additional mental health conditions. A subset of participants (N = 54,127) indicated if they had a formal diagnosis of: 1. ADHD (N = 3189, 5.89%); 2. Bipolar disorder (N = 1532, 2.83%); 3. Depression (N = 11,919, 22.02%); 4. OCD (N = 1419, 2.62%); and 5. Schizophrenia (N = 202, 0.37%).
Autism Physical Health Survey: overview of dataset
The Autism Physical Health Survey (APHS) dataset consists of 2312 individuals aged 16–90 years who were recruited via the Cambridge Autism Research Database (CARD), autism charities and support groups, and social media as a part of a study investigating the association between autism and physical health conditions. The study employed an anonymous, online self-report survey via Qualtrics. Participants were asked questions regarding their demographics, lifestyle factors (including diet, exercise, sleep, and sexual/social history), personal medical history, and family medical history for all first-degree, biological relatives. As the study was anonymous (and we did not collect IP addresses), we excluded records that we determined were likely to be duplicates. We excluded all records that matched a previous record across 11 categories: whether or not they had an autism diagnosis, specific autism diagnosis, type of practitioner who diagnosed them, year of diagnosis, syndromic autism (if applicable), country of residence, sex assigned at birth, current gender identity, age, maternal age at birth, paternal age at birth, and educational attainment.
Autism Physical Health Survey: ascertaining gender identity
Participants were asked for their sex assigned at birth (“Male”, “Female”, “Other”) and for their current gender identity (“Female” (N = 1383), “Male” (N = 766), “Non-binary” (N = 109), and “Other” (N = 20)). We removed participants who indicated “Other” for their sex assigned at birth (N = 1), and who did not complete information on gender identity (N = 3). Additionally, 33 individuals had discordant sex and gender information (7 individuals of male sex but female gender, and 26 individuals of female sex and male gender). As we did not provide a transgender option in the gender identity column, we classified these individuals as transgender. Thus, in total there were 162 individuals who were included in the transgender and gender-diverse group (Supplementary Table S1).
Autism Physical Health Survey: ascertaining autism diagnosis
Participants were asked to indicate if they had an autism diagnosis. Whilst we did not require participants to upload a copy of their diagnostic report, they had to provide further information about which type of clinician diagnosed them as autistic (general practitioner, neurologist, pediatrician, psychiatrist, psychologist or other (free text box)), what their specific diagnosis was, and when they were diagnosed. A total of 1082 individuals indicated that they had an autism diagnosis (Supplementary Table S1).
The IMAGE study: overview of dataset
The Investigating Mathematics and Autism using Genetics and Epigenetics (IMAGE) dataset consists of individuals recruited into a genetic study of autism and mathematical ability. This was done using two different research designs. The first targeted autistic and non-autistic individuals as a part of a case–control design (N final = 292) by advertising in research databases, autism-related magazines, and on social media. The second targeted individuals who studied or were studying mathematics or a related degree (N final = 1803) by advertising in universities, mathematics societies, in mathematics specific or alumni magazines, or on social media. Participants registered at a bespoke website and provided contact details, demographics, and completed various questionnaires. As participants provided both their names and their contact details, we used this information to remove duplicate records.
The IMAGE study: ascertaining gender identity
Participants were asked for their sex at birth (“Male”, “Female” or “Intersex”) and their gender (“Man” (N = 994), “Woman” (N = 747), “Transgender Man” (N = 7), “Transgender Woman” (N = 3), “Nonbinary” (N = 35), “Gender Neutral” (N = 10), “Other” (N = 7), and “Prefer not to say” (N = 15)). We excluded individuals who chose “Intersex” (N = 2) for their sex, and “Prefer not to say” (N = 15) for their gender. Of the remaining, we combined individuals who chose “Man” and “Woman” as the cisgender group (N = 1741), and the remaining into the transgender and gender-diverse group (N = 62). Further details are provided in Supplementary Table S1.
The IMAGE study: ascertaining autism diagnosis
Participants were asked if they had a diagnosis of autism on the autism spectrum (e.g., autism, Asperger Syndrome). As a part of this, we indicated that diagnosis must have been made by a qualified professional (e.g., clinical psychologist or psychiatrist). Participants were also asked when they received an autism diagnosis and who diagnosed them. In addition, autistic individuals in this study were asked to provide a copy of their diagnostic report that we used to confirm their autism diagnosis. A total of 1082 individuals indicated that they had an autism diagnosis (Supplementary Table S1). A subset of participants (N = 1787) provided information on educational attainment. 1417 participants indicated if they suspected they had undiagnosed autism (“Yes” or “No”). This was used to investigate if transgender and gender-diverse non-autistic individuals were more likely to suspect they had undiagnosed autism compared to non-autistic cisgender individuals.
The IMAGE study: measures of traits related to autism
The LifeLines Cohort is a Netherlands-based population cohort study, recruited between 2006 and 201372. Participants were invited through their general practitioners in three northern provinces in the Netherlands (Freisland, Groningen, and Drenthe). Notably, participants were not invited if they had a severe mental health condition, which suggests that this dataset will be biased towards healthy participants. A total of 167,729 participants aged between 6 months and 93 years completed the baseline survey. The LifeLines dataset used in this study consists of 37,975 individuals from the cohort, who responded to an online questionnaire on autistic traits in summer 2019. All participants were at least 18 years of age. The participants in the LifeLines cohort were, on average, about twice as old as the participants in the C4 and the MU cohorts, and this may in part explain the relatively low number of transgender and gender-diverse individuals in this dataset. In addition, 37,574 participants provided information on their highest level of educational attainment (Supplementary Table S2).
Information on gender was collected using one question: “Please choose which description fits you best”. This was followed by five options: “At birth I was registered as female and I am female”, “At birth I was registered as male and I am male”, “At birth I was registered as female, but I am male”, “At birth I was registered as male, but I am female”, and “Different from the options above, namely…”. Participants who chose the final option were required to fill in a short box describing their gender identity. In total, there were 15,527 cisgender males, 22,375 cisgender females, 18 transwomen, 17 transmen and 18 individuals who chose the other option and identified with other gender identities (e.g., genderfluid). Thus, in total, there were 53 transgender and gender-diverse individuals (Supplementary Table S1).
Autism diagnosis was ascertained using the question: “Do you have an autism diagnosis?” followed by “In what year was this diagnosed”. 439 individuals indicated that they had an autism diagnosis (252 cisgender males, 184 cisgender females, and 3 transgender and gender-diverse individuals) (Supplementary Table S1).
LifeLines: measures of traits related to autism
All participants also completed the AQ-1073, provided the age when they completed the AQ-10.
The Human Biology Research Ethics Committee, University of Cambridge, provided ethical approval for the collection and use of data for both the APHS and the IMAGE cohorts. They also provided ethical approval to access de-identified data from the LifeLines cohort. The Psychology Research Ethics Committee of the University of Cambridge confirmed that formal ethical review was not needed for use of the C4 dataset since it was secondary use of deidentified and anonymized data. The same was confirmed for the MU dataset by the Ethical & Independent Review Services. Informed consent was obtained for all participants included in this study.
Statistical analyses: rates of autism diagnosis
In all five datasets, we investigated if rates of autism diagnosis significantly differed by gender by first conducting χ2 tests (Model 1, unadjusted), and then by conducting logistic regressions adjusted for age and educational attainment as covariates (Model 2, adjusted). Both age and educational attainment were associated with autism diagnosis, with younger individuals more likely to receive an autism diagnosis78,79, and educational attainment typically negatively correlated with autism51. Further, these two variables were measured across all five datasets. In addition, for the IMAGE dataset, we included a dummy variable for the two studies participants were drawn from (mathematical ability and case–control) to account for potential confounding effects of recruitment.
Each model was conducted first by using three gender categories (transgender and gender-diverse, male, and female), and then by using two gender categories (transgender and gender-diverse and cisgender). Regression betas were converted to ORs. As an additional sensitivity analysis, only in the MU dataset, we repeated the analyses after dividing the cohort into four groups (“Male”, “Female”, “Transgender”, and “Other”), to investigate if these results differed by gender identity.
Additionally, we also investigated if rates of transgender and gender-diverse individuals vary by autism diagnosis. This was done by using a logistic regression comparing transgender and gender-diverse individuals to cisgender individuals (dependent variable). Autism diagnosis was the independent variable, and educational attainment and age were included as covariates.
Whilst information for this study from all five datasets were collected using internet-based surveys, there are differences between them. Of importance is that sex, gender, and autism diagnosis information were all collected differently in the five datasets. In the C4 and MU datasets, gender information was collected using a single question whereas in the IMAGE and APHS datasets, gender information was collected using two questions—one for sex assigned at birth and another for gender identified with. In the LifeLines dataset, gender information was collected using a single question, but this included options about sex assigned at birth alongside gender. Further, information on autism diagnosis was also collected differently with deeper information provided by participants in the IMAGE, LifeLines, and APHS datasets. There are other cohort-based differences as well. For example, the MU dataset was aggregated over a long period of time and primarily collected from the US, whilst three datasets (C4, APHS, and IMAGE) were collected over a shorter period of time and primarily from the UK. The LifeLines dataset used here was a subset of a cohort study, where participants were invited through general practitioner clinics rather than via the internet. This was collected in the Netherlands and consists of older participants.
Given the heterogeneity in these datasets, we wanted to investigate if the ORs obtained across the five datasets are comparable. Two factors affect ORs: winner’s curse which inflate ORs in smaller cohorts35,36, and lower precision, i.e., higher standard errors of ORs in smaller cohorts80. Thus, ORs are not directly comparable between the datasets. In order to make the ORs comparable, we generated sub-datasets of equivalent sample sizes to the three smaller datasets (IMAGE, APHS, and LifeLines) in the two larger datasets (C4 and MU). We used a subsampling bootstrap approach to compare ORs in the two larger datasets with ORs in the smaller datasets. We generated six sets of 10,000 random subsamples each from the C4 and the MU datasets. Each of the 10,000 subsamples was matched to the numbers of cisgender males, cisgender females and transgender and gender-diverse individuals in the IMAGE, APHS, and LifeLines datasets. Thus, we sampled 10,000 times from the C4 and MU datasets with each sample consisting of 766 cisgender males, 1383 cisgender females, and 162 transgender and gender-diverse individuals to match the APHS dataset. In addition, we also sampled 10,000 times from the C4 and MU datasets with each sample consisting of 994 cisgender males, 747 cisgender females, and 62 transgender and gender-diverse individuals to match the IMAGE dataset. Finally, we sampled 10,000 times from the C4 and MU datasets with each sample consisting of 15,527 cisgender males, 22,375 cisgender females, and 52 transgender and gender-diverse individuals to match the LifeLines dataset. In each sample, we calculated adjusted ORs using logistic regression. We then calculated the empirical p values for the adjusted ORs for the IMAGE, APHS, and LifeLines samples from the distribution of ORs generated in the 10,000 samples from MU and C4. We corrected for the six tests using Bonferroni correction (empirical p value alpha = 0.008).
Statistical analyses: rates of other neurodevelopmental and psychiatric conditions
In the C4 and MU datasets we investigated if diagnosis of six neurodevelopmental and psychiatric conditions differed by gender using χ2 tests (Model 1) and logistic regression accounting for educational attainment and age (Model 2). Additionally, we repeated Model 2 after excluding autistic individuals (Model 3), as there may be an autism-based ascertainment bias in these cohorts. Each model was conducted first by using three gender categories (transgender and gender-diverse, cisgender male, and cisgender female), and then two categories (transgender and gender-diverse and cisgender).
We also investigated the relative association between each neurodevelopmental and psychiatric conditions to gender identity. Gender identity (transgender and gender-diverse versus cisgender) was the dependent variable. The independent variables were diagnosis of ADHD, autism, bipolar disorder, depression, learning disorder (only in C4 dataset), OCD, and schizophrenia. Age and educational attainment were included as covariates.
Statistical analyses: traits related to autism
In the C4 dataset, we investigated differences in scores by gender (cisgender males, cisgender females, and transgender and gender-diverse) on the four measures using ANOVA and then conducted post-hoc T-tests. We repeated the analyses using linear regression accounting for age and educational attainment. Distributions in “Brain Types” between the three genders were investigated using χ2 tests. Validation using the AQ-5077 was conducted in the IMAGE dataset, and using the AQ-10 was conducted in the LifeLines dataset.
Statistical analyses: calculation of “Brain Types”
Calculation of “Brain Types” was only done in the C4 dataset. We first calculated the standardized scores of the SQ-10 and the EQ-10. This was done by subtracting the mean of the SQ-10 and the EQ-10 (means were calculated using only non-autistic individuals from the C4 dataset) from each individual’s score and then dividing by the maximum possible score (20 for both the SQ-10 and the EQ-10). We next calculated a “D-score” by subtracting the standardized EQ-10 score from the SQ-10 score. We then divided individuals into five Brain Types based on D-score percentiles. The lowest 2.5th percentile was Extreme Type E and the highest 2.5th percentile was Extreme Type S. Those scoring between the 35th and 65th percentiles were classified as Type B. Participants who scored between the 2.5th and 35th percentiles were Type E, and Type S was defined by scoring between the 65th and 97.5th percentile.
Across all the datasets and the three aims and the exploratory aim, we conducted at least 182 different analyses. Given the size of the datasets used, the standard errors are low. We thus define a study-wide p-value of 0.0002 to correct for all the tests. Details of the tests conducted are provided in Supplementary Table S11.
Statistical analyses: power calculations in the LifeLines dataset
Given the relatively low number of transgender and gender-diverse individuals, we conducted power calculations to investigate if the LifeLines cohort had sufficient statistical power to identify effects. We used effect sizes obtained from the results of the C4 dataset as this was the largest dataset, and hence, likely to have effects that are least affected by winner’s curse (“Supplementary Methods”). Power calculations suggested that we were underpowered to detect effects at an alpha of 0.05 for calculating ORs using logistic regression, with power achieved between 0.62 (reference group: cisgender males)—0.69 (reference group: cisgender females). However, we proceeded with the analyses to identify if the effects observed were in the same direction as those observed in other datasets.
Further information on research design is available in the Nature Research Reporting Summary linked to this article.
Tooladrake on August 9th, 2020 at 14:46 UTC »
That's funny because. In france, when you want to start a transition you have to pass by a protocol where you see psychiatrist (and surgeon/endocrynologist) and my 3 psychiatrist told me
"You have an odd personality" and one of them asked me if i wanted to pass some test.
having nothing else to do, i said "sure"
And then i endup with having a score of 4/100 on empathy level and a score of 32/50 on the autistic ladder who class me as an asperger. and i have now a appointement with the autistic center of my region to make more test. gonna be fun.
lifelessalarm on August 9th, 2020 at 11:25 UTC »
Research also shows additional orientation-related differences in autistic populations. A lesser known one being objectum sexuality (being sexually attracted to inanimate objects). OS gets a lot of ridicule, but in many cases it cannot simply be passed off as people being “weird” or “obscure”. It’s actually tied to being autistic and is likely the result of the complex manifestation of autism related symptoms (e.g. the tendency to fixate) as well as a particular sub-type of synaesthesia causing increased anthropomorphism (I.e. object-personality synaesthesia). The same study also found that the autistic group reported an increased range of orientations and gender diversity.
The accumulating evidence clearly shows a link between gender and orientation diversity and autism.
https://scholar.google.com/scholar?hl=en&as_sdt=0%2C5&q=objectum+sexuality&btnG=#d=gs_qabs&u=%23p%3DJ1ttWwZQfigJ
Edit: to clarify, objectum sexuality doesn’t only refer to “sexual” attraction, it also includes romantic attraction. Not all objectum sexuals use their objects for sexual gratification. I mention this because OS can sometimes be mistaken for a paraphilia, and this might further contribute to the negative stereotype.
thenerj47 on August 9th, 2020 at 09:50 UTC »
This makes sense, given how subjects describe 'masking' as part of daily life in all of the above neurological phenomena.