Context A critical question in pandemic influenza planning is the role nonpharmaceutical interventions might play in delaying the temporal effects of a pandemic, reducing the overall and peak attack rate, and reducing the number of cumulative deaths. Such measures could potentially provide valuable time for pandemic-strain vaccine and antiviral medication production and distribution. Optimally, appropriate implementation of nonpharmaceutical interventions would decrease the burden on health care services and critical infrastructure.
Objectives To examine the implementation of nonpharmaceutical interventions for epidemic mitigation in 43 cities in the continental United States from September 8, 1918, through February 22, 1919, and to determine whether city-to-city variation in mortality was associated with the timing, duration, and combination of nonpharmaceutical interventions; altered population susceptibility associated with prior pandemic waves; age and sex distribution; and population size and density.
Design and Setting Historical archival research, and statistical and epidemiological analyses. Nonpharmaceutical interventions were grouped into 3 major categories: school closure; cancellation of public gatherings; and isolation and quarantine.
Main Outcome Measures Weekly excess death rate (EDR); time from the activation of nonpharmaceutical interventions to the first peak EDR; the first peak weekly EDR; and cumulative EDR during the entire 24-week study period.
Results There were 115 340 excess pneumonia and influenza deaths (EDR, 500/100 000 population) in the 43 cities during the 24 weeks analyzed. Every city adopted at least 1 of the 3 major categories of nonpharmaceutical interventions. School closure and public gathering bans activated concurrently represented the most common combination implemented in 34 cities (79%); this combination had a median duration of 4 weeks (range, 1-10 weeks) and was significantly associated with reductions in weekly EDR. The cities that implemented nonpharmaceutical interventions earlier had greater delays in reaching peak mortality (Spearman r = −0.74, P < .001), lower peak mortality rates (Spearman r = 0.31, P = .02), and lower total mortality (Spearman r = 0.37, P = .008). There was a statistically significant association between increased duration of nonpharmaceutical interventions and a reduced total mortality burden (Spearman r = −0.39, P = .005).
Conclusions These findings demonstrate a strong association between early, sustained, and layered application of nonpharmaceutical interventions and mitigating the consequences of the 1918-1919 influenza pandemic in the United States. In planning for future severe influenza pandemics, nonpharmaceutical interventions should be considered for inclusion as companion measures to developing effective vaccines and medications for prophylaxis and treatment.
The influenza pandemic of 1918-1919 was the most deadly contagious calamity in human history. Approximately 40 million individuals died worldwide, including 550 000 individuals in the United States.1-4 The historical record demonstrates that when faced with a devastating pandemic, many nations, communities, and individuals adopt what they perceive to be effective social distancing measures or nonpharmaceutical interventions including isolation of those who are ill, quarantine of those suspected of having contact with those who are ill, school and selected business closure, and public gathering cancellations.5,6 One compelling question emerges: can lessons from the 1918-1919 pandemic be applied to contemporary pandemic planning efforts to maximize public health benefit while minimizing the disruptive social consequences of the pandemic as well as those accompanying public health response measures?7-10
Most pandemic influenza policy makers agree that even the most rigorous nonpharmaceutical interventions are unlikely either to prevent a pandemic or change a population's underlying biological susceptibility to the pandemic virus. However, a growing body of theoretical modeling research suggests that nonpharmaceutical interventions might play a salubrious role in delaying the temporal effect of a pandemic; reducing the overall and peak attack rate; and reducing the number of cumulative deaths.11-15 Such measures could potentially provide valuable time for production and distribution of pandemic-strain vaccine and antiviral medication. Optimally, appropriate implementation of nonpharmaceutical interventions would decrease the burden on health care services and critical infrastructure.
The historical record of the 1918-1919 influenza pandemic in the United States constitutes one of the largest recorded experiences with the use of nonpharmaceutical interventions to mitigate an easily spread, high mortality and morbidity influenza virus strain (ie, a category 4-5 pandemic using the Centers for Disease Control and Prevention February 2007 Interim Pre-Pandemic Planning Guidance).16 Our study focused on this data set by assessing the nonpharmaceutical interventions implemented in 43 cities in the continental United States from September 8, 1918, through February 22, 1919, a period that encompasses all of the second pandemic wave (September-December 1918) and the first 2 months of the third wave (January-April 1919) and represents the principal time span of activation and deactivation of nonpharmaceutical interventions. The purpose was to determine whether city-to-city variation in mortality was associated with the timing, duration, and combination (or layering) of nonpharmaceutical interventions; altered population susceptibility associated with prior pandemic waves; age and sex distribution; and population size and density.
We combined systematic historical data collection and contemporary epidemiological and statistical analytic tools. Mortality data were obtained from the US Census Bureau's Weekly Health Index17 for 1918-1919, a series of reports listing total deaths and death rates for 43 large US cities. These 43 cities were among the 66 most populous urban centers according to the 1920 census, and all had a population greater than 100 000. Of the 66 most populous cities, the remaining 23 had incomplete archival and mortality records. No city with a comprehensive archival record of nonpharmaceutical interventions was excluded. The Weekly Health Index is the most complete extant compilation of weekly pneumonia and influenza mortality data in US urban areas during the 1918-1919 pandemic.
In addition, we captured all of the available public health documents on nonpharmaceutical interventions implemented by these 43 cities during the 1918-1919 pandemic, including municipal public health department annual and monthly reports and weekly bulletins; every state and federal report on the 1918-1919 influenza pandemic published between 1917 and 1922; US Census pneumonia and influenza mortality data from 1910-1920; the corpus of published historical, medical, and public health literature on the 1918-1919 pandemic; 86 different newspapers from the 43 different cities; records of US military installations between 1917-1920; and additional holdings housed in several major libraries and archival repositories (the complete bibliography of the 1144 primary and secondary sources is available as an online supplement at http://www.cdc.gov/ncidod/dq/index.htm).17-23
From the census reports, we extracted the weekly pneumonia and influenza mortality data covering the 24 weeks from September 8, 1918, through February 22, 1919, for the 43 US cities. In 1920, these 43 cities had a combined population of approximately 23 million (22% of the total US population). A small number of missing values (846 [0.6%] of 136 563 deaths) was imputed. Using estimated weekly baseline pneumonia and influenza death rates generated from the 1910-1916 median monthly values found by Collins et al,18 weekly excess death rates (EDR) were computed. Based on available mortality data and epidemiological reports from that era, as well as a recent retrospective statistical analysis, we estimated that those who succumbed to influenza contracted it 10 days earlier.3,24-27
The onset of the epidemic in a particular city was estimated as either the day of the first reported pneumonia and influenza case, or the calendar day of the first recorded pneumonia and influenza death minus 10 days, whichever was earlier. Information on nonpharmaceutical interventions was captured by reviewing at least 2 daily, high-circulation newspapers for each city and available municipal or state health reports. Nonpharmaceutical interventions were grouped into 3 major categories: school closure; public gathering bans; and isolation and quarantine. We also considered an additional general category of ancillary nonpharmaceutical interventions (eg, altering work schedules, limited closure or regulations of businesses, transportation restrictions, public risk communications, face mask ordinances).
Nonpharmaceutical interventions were considered either activated (“on”) or deactivated (“off”), according to data culled from the historical record and daily newspaper accounts. Specifically, these nonpharmaceutical interventions were legally enforced and affected large segments of the city's population. Isolation of ill persons and quarantine of those suspected of having contact with ill persons refers only to mandatory orders as opposed to voluntary quarantines being discussed in our present era. School closure was considered activated when the city officials closed public schools (grade school through high school); in most, but not all cases, private and parochial schools followed suit. Public gathering bans typically meant the closure of saloons, public entertainment venues, sporting events, and indoor gatherings were banned or moved outdoors; outdoor gatherings were not always canceled during this period (eg, Liberty bond parades); there were no recorded bans on shopping in grocery and drug stores. Based on an estimated 10-day time frame between disease onset and death, we estimated that the association of nonpharmaceutical interventions with reductions in EDR occurred 10 days after their actual date of implementation.3,24-27
To test the association of the layering and timing of nonpharmaceutical interventions with mortality, an analysis of variance (ANOVA) model was constructed with weekly EDR as the dependent variable and epidemiological week, city, and the status (on/off) of every combination of nonpharmaceutical interventions as the independent variables. In the ANOVA model, each possible combination of nonpharmaceutical interventions was treated as an independent variable to test for layering effects. Any factor with a P value of less than .10 was included in the model. Because there is ambiguity over the rigor with which the category of ancillary nonpharmaceutical interventions was applied, enforced, and deactivated, we focused primarily on the 3 major categories of nonpharmaceutical interventions discussed above and we included the ancillary nonpharmaceutical interventions in the multivariate model for purposes of completeness.
We defined additional outcome (dependent) variables: (1) the time to first peak as the time in days from the activation of the first major category of nonpharmaceutical interventions to the date of the first peak EDR; (2) the magnitude of the first peak as the first peak weekly EDR; and (3) the mortality burden as the cumulative EDR during the entire 24-week study period.
We also defined the following independent variables. The first was the public health response time (PHRT) as the time in days (either positive or negative) between the date when weekly EDR first exceeds twice the baseline pneumonia and influenza death rate (2 × baseline; ie, when the mortality rate begins to accelerate) and the activation of the first major nonpharmaceutical interventions. Interventions that occurred prior to this reference point are recorded as negative PHRT values, indicating that public health officials responded to events prior to the acceleration of weekly death rates. However, most cities had positive PHRT in that they reacted after the 2 × baseline mortality threshold, indicating that the epidemic had already entered its acceleration phase. The second independent variable was total days of nonpharmaceutical interventions, which was defined as the total cumulative number of days that nonpharmaceutical interventions from the 3 major categories were activated during the entire 24-week study period.
The ANOVA models were based on the study design of a 43 (city) × 24 (week) factorial design without replication. Because there is no replication, the city × week interaction term was treated as the error term in the multivariate analysis. We considered 4 different nonpharmaceutical interventions. Hence, there are 15 different combinations of these interventions (excluding the no intervention combination). Each of these 15 combinations was either implemented (on) or not implemented (off) in each city for each week. Thus, the effects of each of these combinations of nonpharmaceutical interventions are included in the city × week interaction term. Each of these terms (along with their × city and × week interaction terms) were extracted from the original city × week interaction term. The remaining unexplained variation was used as the error term in the ANOVA model. The remaining error term is likely to be larger than a true error term generated through replication so the analysis of any effects using this error term can be expected to be conservative. Such a factorial model without replication can be used to test hypotheses but the lack of natural error in the model makes estimates or predictions from the model such as effect size measures and confidence intervals nonestimable.
We also generated scatterplots and Spearman rank correlation coefficients to explore the associations between PHRT and each of the 2 additional dependent variables and associations between total days of nonpharmaceutical interventions and mortality burden. We further investigated these associations by using box plots and Wilcoxon rank sum tests to compare the outcomes for the cities above and below the median of each independent variable.
We also generated scatterplots and Spearman rank correlation coefficients to explore other potential or confounding associations (as independent determinants): (1) EDR in the 4 successive waves of the pandemic; (2) city-specific population size vs EDR; (3) city-specific population density vs EDR; (4) city-specific population age distribution vs EDR; and (5) city-specific sex distribution vs EDR. Analyses were performed using SAS statistical software version 9.1 (SAS Institute Inc, Cary, NC).
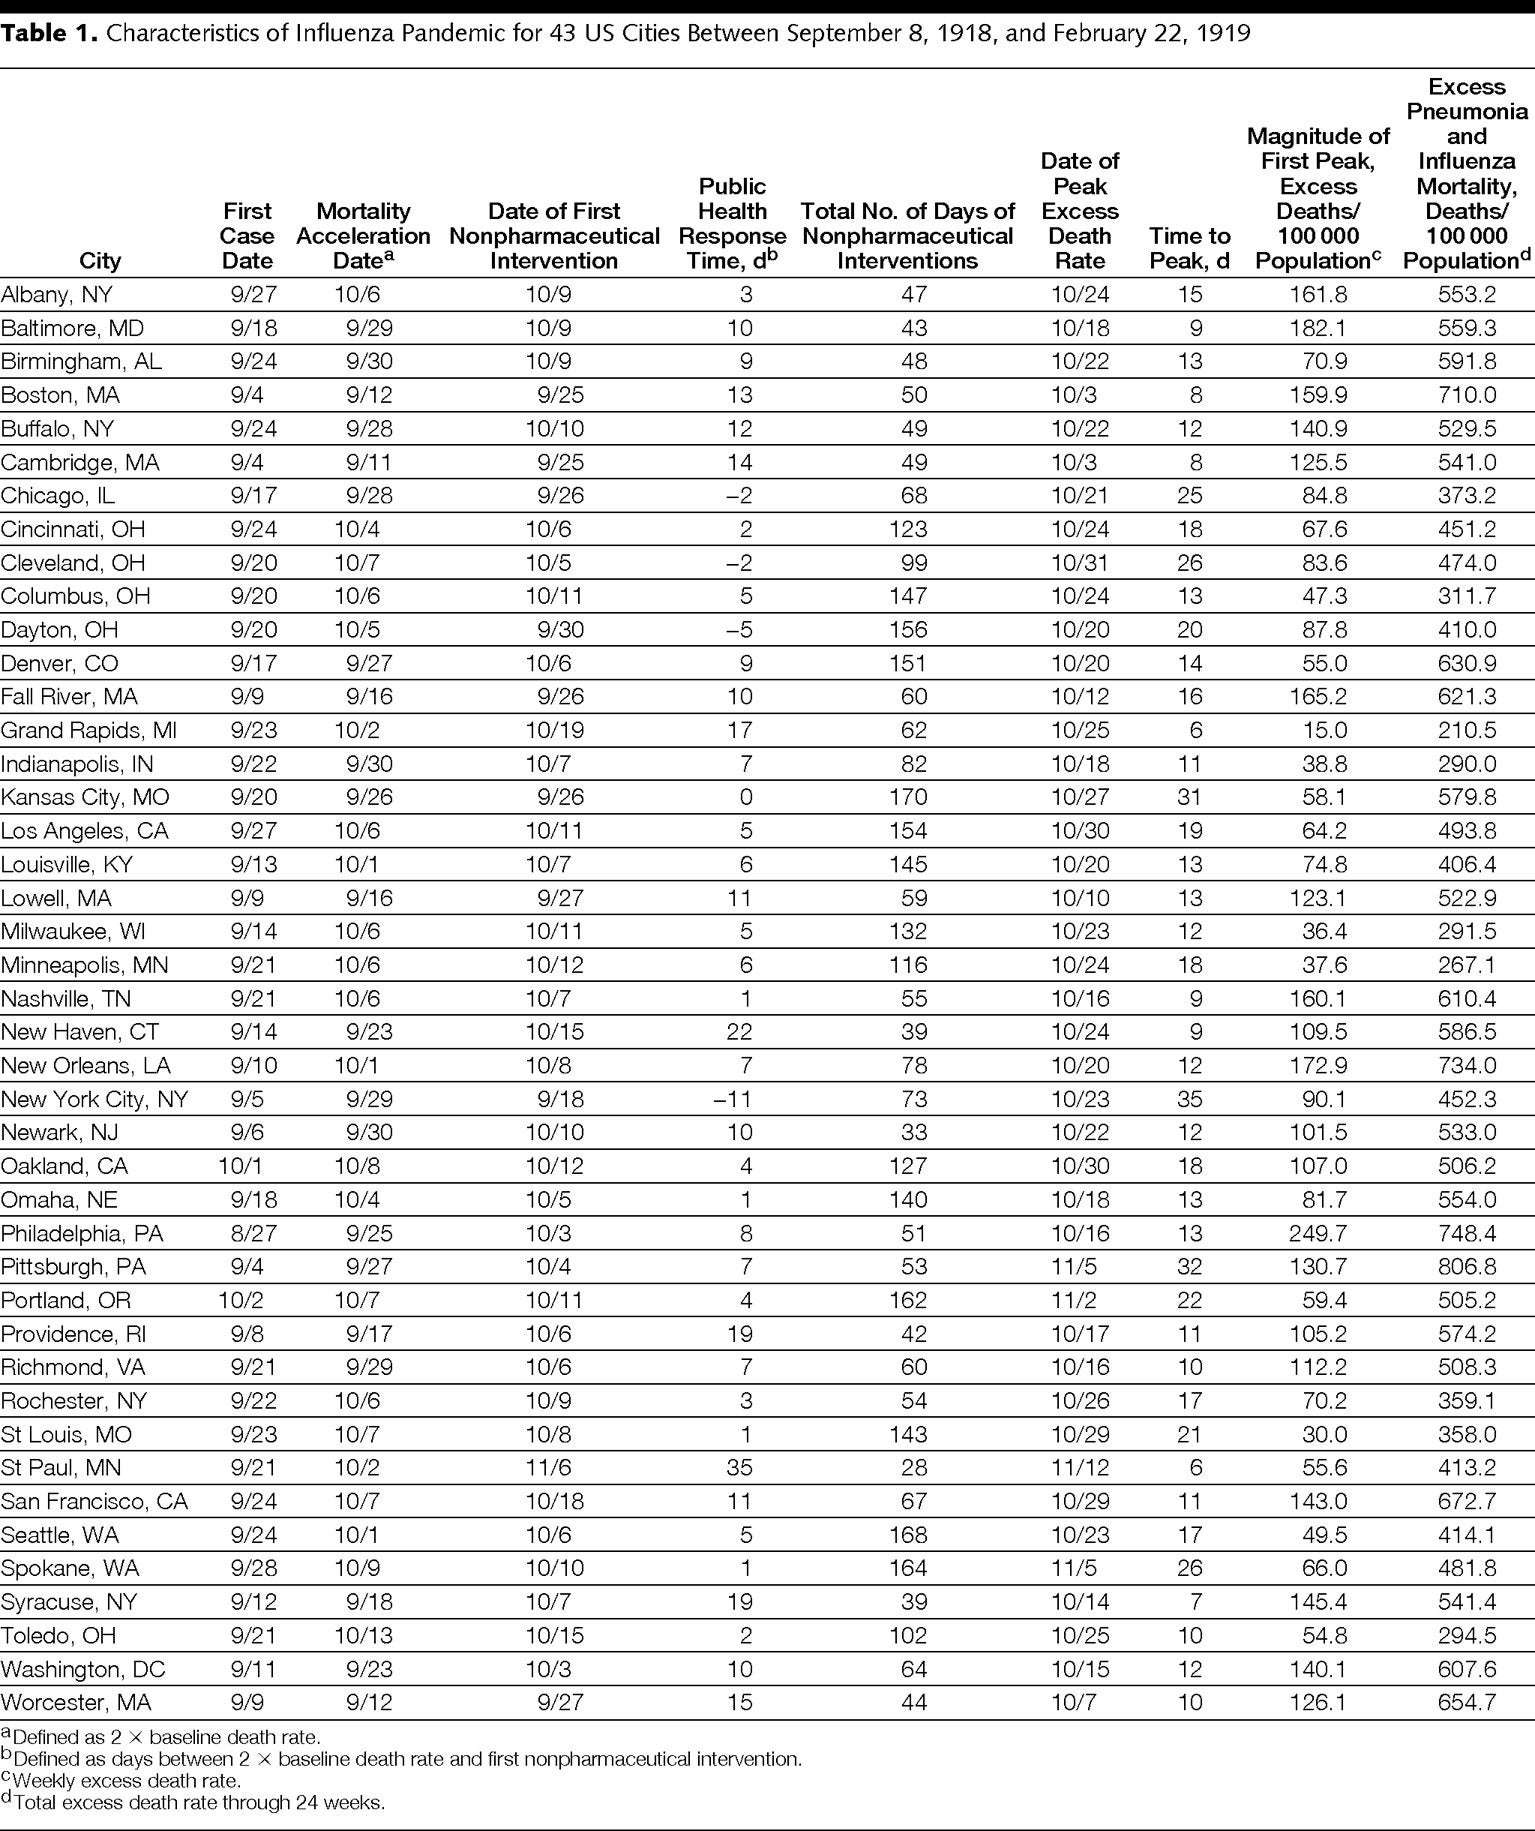
There were 115 340 excess pneumonia and influenza deaths (EDR, 500/100 000 population) in the 43 cities during the 24 weeks analyzed. Table 1 shows considerable city-to-city variation in mortality profiles and intervention characteristics; lists the earliest reported dates of the first pneumonia and influenza cases by city, mortality acceleration (2 × baseline EDR), first implementation of nonpharmaceutical interventions, and first peak EDR; and lists the values for each of the independent and outcome variables described above.
Table 2 shows the categories of nonpharmaceutical intervention combinations, the number of cities implementing those combinations, and the median and range of duration of implementation by each of the 43 cities during the study period. Every city adopted at least 1 of the 3 major categories of nonpharmaceutical interventions; 15 applied all 3 categories of nonpharmaceutical interventions concurrently. School closure concurrently combined with public gathering bans represented the most common combination, implemented in 34 cities (79%) for a median duration of 4 weeks (range, 1-10 weeks). School closure was ultimately used in some combination with the other categories of nonpharmaceutical interventions by 40 cities (93%). Three cities never officially closed their schools (New York City, New York, New Haven, Connecticut, and Chicago, Illinois, although the latter reported a student absenteeism rate of ≥45% at the peak of its epidemic); 25 cities closed their schools once, 14 closed them twice, and 1 (Kansas City, Missouri) closed its schools 3 times. Schools were officially closed a median of 6 weeks (range, 0-15 weeks).
The ANOVA multivariate model had an r2 of 86.7% (P < .001). Nonpharmaceutical interventions were a significant source of the variation in the weekly EDRs within and between the cities. The ANOVA results are shown in Table 3. The multivariate model demonstrates that layered nonpharmaceutical interventions generally had a more significant association with weekly EDR than individual nonpharmaceutical interventions. Specifically, combinations of nonpharmaceutical interventions including school closure and public gathering bans appeared to have the most significant association with weekly EDR (ie, the lowest P values, most were P<.001). The large number of significant nonpharmaceutical interventions × week interactions in the model confirms that the timing of the implementation of a given combination of nonpharmaceutical interventions was a significant factor in reducing mortality. One caveat is persistent nonpharmaceutical interventions × city interactions, meaning that the success of a strategy of nonpharmaceutical interventions in a particular city does not uniformly translate to all other cities. The 2 outlier cities in our study, Grand Rapids, Michigan, and St Paul, Minnesota, exemplify this point.
The scatterplots in Figure 1A, Figure 1B, and Figure 1C display the associations between the PHRT and each of the 3 dependent variables. Figure 1A displays the association between PHRT in days and time to first peak EDR; cities that implemented nonpharmaceutical interventions earlier had greater delays in reaching peak mortality (Spearman r = −0.74, P < .001). Figure 1B shows the association between PHRT and the magnitude of the first peak EDR; cities that implemented nonpharmaceutical interventions earlier had lower peak mortality rates (Spearman r = 0.31, P = .02). Figure 1C depicts the association between PHRT and total mortality burden; cities that implemented nonpharmaceutical interventions earlier experienced a lower total mortality (Spearman r = 0.37, P = .008). In summary, when comparing the 21 cities with earlier (less than the median) PHRT with the 21 cities with the later (greater than the median) PHRT, there are statistically significant differences for each of the outcome measures (P ≤ .001; Table 4).
Figures 1C and 1D show the association between early, sustained, and layered application of nonpharmaceutical interventions and total excess pneumonia and influenza mortality burden in 43 cities. Figure 1C shows the statistically significant association between PHRT and total mortality burden. Figure 1D shows a statistically significant association between increased duration of nonpharmaceutical interventions and a reduced total mortality burden (Spearman r = −0.39, P = .005). In summary, the 21 cities that had earlier PHRT (ie, less than the median) and the most sustained and most days of nonpharmaceutical interventions had a statistically significant reduction in excess pneumonia and influenza mortality rates compared with the 21 cities that had later PHRT and fewer days of nonpharmaceutical interventions (Table 4).
Figure 2 shows the aggregate city mortality curves by region (East, Midwest and South, and West). Figure 3 displays 4 city-specific mortality curves, including weekly EDR and the nonpharmaceutical interventions implemented as well as their activation and deactivation dates for St Louis, Missouri, New York City, Denver, Colorado, and Pittsburgh, Pennsylvania. These 4 cities were chosen because they indicate the broad spectrum of outcomes seen in the 43 cities studied as well as for their geographical and social diversity. (The mortality curves for all 43 cities are available at http://www.cdc.gov/ncidod/dq/index.htm.) Overall, cities that implemented nonpharmaceutical interventions earlier experienced associated delays in the time to peak mortality, reductions in the magnitude of the peak mortality, and decreases in the total mortality burden.
In exploring alternative and potentially confounding explanations for variation in city-specific EDR, we used a scatterplot to compare the cumulative EDR of the 43 cities during pandemic waves 1 (February-May 1918), 2 (September-December 1918), 3 (January-April 1919), and 4 (January-April 1920).2,3 We found no statistically significant association of the EDR across the 43 cities when comparing successive waves. Specifically, the severity or occurrence of wave 1 is not associated, either positively or negatively, with the severity of wave 2; the severity of wave 2 is not associated with the severity of wave 3; and the severity of wave 3 is not associated with the severity of wave 4 (figures appear in the online supplement at http://www.cdc.gov/ncidod/dq/index.htm).28,29
Published virological evidence for strain variation during wave 2 is limited to a single genotypic variant without evidence for significant phenotypic change in virulence.30-33 While plausible, no virological evidence yet exists to explain the perplexing mortality difference between the spring 1918 wave, which was reportedly milder, and the subsequent fall and winter waves. Additional studies may clarify the understanding of the 1918 pandemic's wave phenomena.
Similarly, scatterplots comparing the cumulative EDR to the city-specific population size and density; sex distribution; and proportion of ages of younger than 1 month to 5 years, 15 to 40 years, and older than 65 years, which corresponded to high reported specific mortality rates in 1918 demonstrated no association. Among the 43 cities we investigated, neither the city's population size, density, sex distribution, nor age distribution accounted for the differences in mortality (figures appear in supplement at http://www.cdc.gov/ncidod/dq/index.htm).
During the 1918-1919 influenza pandemic, all 43 cities eventually implemented nonpharmaceutical interventions but the time of activation, duration, and choice or combination of these nonpharmaceutical interventions appear to have been key factors in their success or failure. In 1918, decisions to activate nonpharmaceutical interventions were typically triggered by excess morbidity, mortality, or both, as well as situational awareness of other communities near and far. Because discerning precisely the first arrival of pandemic virus in a community was difficult, we chose to measure public health response time in reference to excess pneumonia and influenza mortality (ie, when weekly EDR first crossed the threshold of 2 × the baseline and the mortality rates entered an acceleration phase). Hence, the difference in time between the first nonpharmaceutical interventions and this excess mortality threshold may be a positive or negative value. For example, in Philadelphia, Pennsylvania, which was affected early and was unprepared to respond, the PHRT was 8 and the EDR was approximately 37/100 000 population at the point of implementing nonpharmaceutical interventions; in contrast, New York City's PHRT was −11 days and the EDR was 0/100 000 population at the point of implementing nonpharmaceutical interventions. New York City responded to its first influenza cases and the perceived severity of the epidemic in nearby cities without waiting for excess deaths to accumulate.
The US Centers for Disease Control and Prevention's newly released interim community mitigation guidance recommends activating nonpharmaceutical interventions when outbreaks due to a pandemic virus strain first are confirmed in a state or metropolitan service region.16 Several theoretical models suggest that the effect of targeted, layered strategies for nonpharmaceutical interventions may be optimized when community influenza attack rates are 1% or lower.11-15 Given the exponential growth of an unmitigated influenza pandemic, it is reasonable to expect that the timing of interventions will be among the most critical factors. Such expectations and biological realities are consistent with our observations of the 1918 pandemic, when rapid public health response time was a critical factor in the successful application of nonpharmaceutical interventions.
Late interventions, regardless of their duration or permutation of use, almost always were associated with worse outcomes. However, timing alone was not consistently associated with success. The combination and choice of nonpharmaceutical interventions also appeared to be critical as confirmed by the multivariate model.
For example, New York City reacted earliest to the gathering influenza crisis, primarily with the sustained (>10 weeks beginning September 19, 1918) and rigidly enforced application of compulsory isolation and quarantine procedures, along with an enforced staggered business hour ordinance from October 5 through November 3, 1918.34 During this era, New York City's health department was renowned internationally for its innovative policies of mandatory case reporting and rigidly enforced isolation and quarantine procedures.35 Typically, individuals diagnosed with influenza were isolated in hospitals or makeshift facilities, while those suspected to have contact with an ill person (but who were not yet ill themselves) were quarantined in their homes with an official placard declaring that location to be under quarantine. New York City mounted an early and sustained response to the epidemic and experienced the lowest death rate on the Eastern seaboard but it did not layer its response. New York City's cumulative mortality burden, 452/100 000, ranked 15 out of the 43 cities studied.
In contrast, Pittsburgh, under orders from the Pennsylvania health department, executed a public gathering ban on October 4, 1918, but city officials delayed until October 24 before implementing school closure. A week later, on November 2, the state rescinded public gathering bans. The city applied its nonpharmaceutical interventions late and individually rather than combined. Pittsburgh's cumulative excess mortality burden (EDR = 807/100 000) ranked 43 out of 43 cities during the study period.
However, the benefits of these interventions were not equally distributed. Those cities acting in a timely and comprehensive manner appear to have benefited most in terms of reductions in total EDR. For example, St Louis, which implemented a relatively early, layered strategy (school closure and cancellation of public gatherings), and sustained these nonpharmaceutical interventions for about 10 weeks each, did not experience nearly as deleterious an outbreak as 36 other communities in the study (cumulative EDR = 358/100 000 population).
The 1918 experience suggests that sustained nonpharmaceutical interventions are beneficial and need to be “on” throughout the particular peak of a local experience. Many of the 43 cities in the study, particularly in the Midwest and South and West, experienced 2 peaks of excess pneumonia and influenza mortality (eg, Birmingham, Alabama, Cincinnati, Ohio, Columbus, Ohio, Denver, Indianapolis, Indiana, Kansas City, Louisville, Kentucky, Milwaukee, Wisconsin, Minneapolis, Minnesota, Oakland, California, Omaha, Nebraska, Portland, Oregon, Rochester, New York, St Louis, San Francisco, California, Seattle, Washington, Spokane, Washington, Toledo, Ohio; see figures in online supplement at http://www.cdc.gov/ncidod/dq/index.htm). These second peaks frequently followed the sequential activation, deactivation, and reactivation of nonpharmaceutical interventions, highlighting the transient protective nature of nonpharmaceutical interventions and the need for a sustained response. For example, Denver (cumulative EDR = 631/100 000 population) responded twice with an extensive menu of nonpharmaceutical interventions that included public gathering bans, school closure, isolation and quarantine, and several ancillary nonpharmaceutical interventions and these actions are reflected temporally in its 2-peak mortality curve.
Such dual-peaked cities are of particular interest because of the specificity and temporal associations between excess mortality and the triggers of activation and deactivation of nonpharmaceutical interventions and the implications for a causal relationship. Among the 43 cities, we found no example of a city that had a second peak of influenza while the first set of nonpharmaceutical interventions were still in effect, suggesting that each city with a bimodal pattern served as its own control. In dual-peaked cities, activation of nonpharmaceutical interventions was followed by a diminution of deaths and, typically, when nonpharmaceutical interventions were deactivated, death rates increased.
History is not a predictive science. There exist numerous well-documented and vast differences between US society and public health during the 1918 pandemic compared with the present. We acknowledge the inherent difficulties of interpreting data recorded nearly 90 years ago and contending with the gaps, omissions, and errors that may be included in the extant historical record. The associations observed are not perfect; for example, 2 outlier cities (Grand Rapids and St Paul) experienced better outcomes with less than perfect public health responses. Future work by our research team will explore social, political, and ecological determinants, which may further help to explain some of this variation.
The United States of 1918 had many similar features to the present era: rapid transportation in the form of trains and automobiles; rapid means of communication in the form of the telegraph and telephone; large, heterogeneous populations with substantial urban concentrations (although a much higher percentage of the US population lived in rural areas compared with the present); a news system that was able to circulate information widely during the epidemic, including many daily newspapers and broadsheets distributed in communities; and a wide spectrum of public health agencies at various levels of government.
When examining the 1918 pandemic, however, it is important to recognize the numerous social, cultural, and scientific differences that do exist between that period and the present. For example, the legal understanding of privacy, civil, and constitutional rights as they relate to public health and governmentally directed measures (such as mass vaccination programs) has changed markedly over the past 9 decades. In addition, public support of and trust in these measures, along with trust in the medical profession as a whole, has shifted over time. Finally, other features of the modern era that need to be considered when applying lessons from history to the present era include the increased speed and mode of travel, above all high-volume commercial aviation; instantaneous access to information via the Internet and personal computers; a baseline understanding among the general population that the etiologic agents of infectious diseases are microbial; and advances in medical technology and therapeutics that have expanded considerably the options available for dealing with a pandemic.
Historical contextual issues and statistical limitations aside, the US urban experience with nonpharmaceutical interventions during the 1918-1919 pandemic constitutes one of the largest data sets of its kind ever assembled in the modern, postgerm theory era.
Our findings conform to 8 of A. Bradford Hill's 9 tenets on causal associations in the consideration of disease and the environment.36 Specifically, during the 1918-1919 pandemic, the relation of early, sustained, and layered nonpharmaceutical interventions to EDR in 43 US cities demonstrate satisfaction of the criteria of strength (the magnitude and statistical significance of our findings, which also argue against an association by chance alone), consistency (early and combined nonpharmaceutical interventions were consistently associated with reductions in mortality, and our analysis is consistent with 2 recent smaller, preliminary historical epidemiological reports, although these studies look at only 16 US urban centers, do not include actual activation and deactivation time points, duration, or layering of nonpharmaceutical interventions, and rely extensively on secondary historical sources.37,38
Further, our retrospective study is consistent with the results from recent theoretical models of the spread of a contemporary pandemic, which highlight the value of early, combined, and sustained nonpharmaceutical interventions to mitigate a pandemic11-15), specificity (best demonstrated in cities with bimodal mortality peaks when the triggers were activated, deactivated, and reactivated), temporality (interventions always preceded the reduction of EDR), dose response (layering and increased duration of the nonpharmaceutical interventions were associated with better outcomes), biological plausibility (these interventions reduce person-to-person interactions and biologically would be expected to reduce the spread of a communicable agent such as influenza), coherence (our data align with the established body of knowledge on the epidemiology of influenza), and analogy (isolation and social distancing have been demonstrated as effective means of preventing person-to-person spread of other respiratory tract diseases, such as rhinovirus, severe acute respiratory syndrome, respiratory syncytial virus, varicella, and seasonal influenza).
The ninth tenet, experiment, could not be demonstrated directly because of the paucity of influenza pandemics in the past century, the trend away from such traditional public health measures for disease control during the past 50 years, and ethical limitations of using population-wide nonpharmaceutical interventions in the absence of a serious threat.
These findings contrast with the conventional wisdom that the 1918 pandemic rapidly spread through each community killing everyone in its path. Although these urban communities had neither effective vaccines nor antivirals, cities that were able to organize and execute a suite of classic public health interventions before the pandemic swept fully through the city appeared to have an associated mitigated epidemic experience. Our study suggests that nonpharmaceutical interventions can play a critical role in mitigating the consequences of future severe influenza pandemics (category 4 and 5) and should be considered for inclusion in contemporary planning efforts as companion measures to developing effective vaccines and medications for prophylaxis and treatment. The history of US epidemics also cautions that the public's acceptance of these health measures is enhanced when guided by ethical and humane principles.39-41
Corresponding Author: Martin S. Cetron, MD, Division of Global Migration and Quarantine, Centers for Disease Control and Prevention, 1600 Clifton Rd, Mailstop E-03, Atlanta, GA 30333 ([email protected]).
Author Contributions: Drs Markel and Cetron had full access to all of the data in the study and take responsibility for the integrity of the data and the accuracy of the data analysis.
Study concept and design: Markel, Lipman, Navarro, Stern, Cetron.
Acquisition of data: Markel, Navarro, Sloan, Michalsen, Stern.
Analysis and interpretation of data: Markel, Lipman, Navarro, Sloan, Michalsen, Stern, Cetron.
Drafting of the manuscript: Markel, Lipman, Navarro, Sloan, Michalsen, Stern, Cetron.
Critical revision of the manuscript for important intellectual content: Markel, Lipman, Navarro, Stern, Cetron.
Administrative, technical, or material support: Markel, Navarro, Sloan, Michalsen, Cetron.
Funding/Support: This study was funded by a contract from the US Centers for Disease Control and Prevention (Sol No. 2006-N-08562, Non-Pharmaceutical Interventions Study/contract 200-2006-16894).
Role of the Sponsor: The US Centers for Disease Control and Prevention provided funding as part of pandemic preparedness research. Drs Cetron and Lipman from the Division of Global Migration and Quarantine at the Centers for Disease Control and Prevention participated as full scientific collaborators in the investigation.
Acknowledgment: Matthew Cartter, MD, MPH, Cleto DiGiovanni Jr, Jeffrey Duchin, MD, Bruce Gellin, MD, Richard Goodman, MD, JD, Daniel Jernigan, MD, MPH, Lisa Koonin, MN, MPH, Anthony Marfin, MD, Martin Meltzer, PhD, William Thompson, PhD, David Shay, MD, and Mary Wilson, MD, provided constructive review of this manuscript. No one mentioned in this section was compensated for contributing.
augustinax on March 5th, 2020 at 06:13 UTC »
I live in Japan, and all public schools are closed at the moment. I really hope it makes a difference in the spread of coronavirus. Now we’ve got to do something about jam packed trains...
EDIT: Depending on the area, some public schools are still opened. But in my area, all public and private schools are closed.
yahma on March 5th, 2020 at 05:39 UTC »
Never will happen in California. Over here Disneyland is still packed with two hour long wait for rides. It's like Californians think they are immune. Everyone I spoke with told me it's just the flu.
carc on March 5th, 2020 at 05:31 UTC »
This is the type of research that saves lives -- if I could upvote this a hundred times, I would.