Connecting decision makers to a dynamic network of information, people and ideas, Bloomberg quickly and accurately delivers business and financial information, news and insight around the world.
China’s War on Pollution Will Change the World
China is cracking down on pollution like never before, with new green policies so hard-hitting and extensive they can be felt across the world, transforming everything from electric vehicle demand to commodities markets. Four decades of breakneck economic growth turned China into the world’s biggest carbon emitter. But now the government is trying to change that without damaging the economy—and perhaps even use its green policies to become a leader in technological innovation. So, as lawmakers attend the annual National People’s Congress, here’s a look at the impact of the environmental focus, at home and abroad.
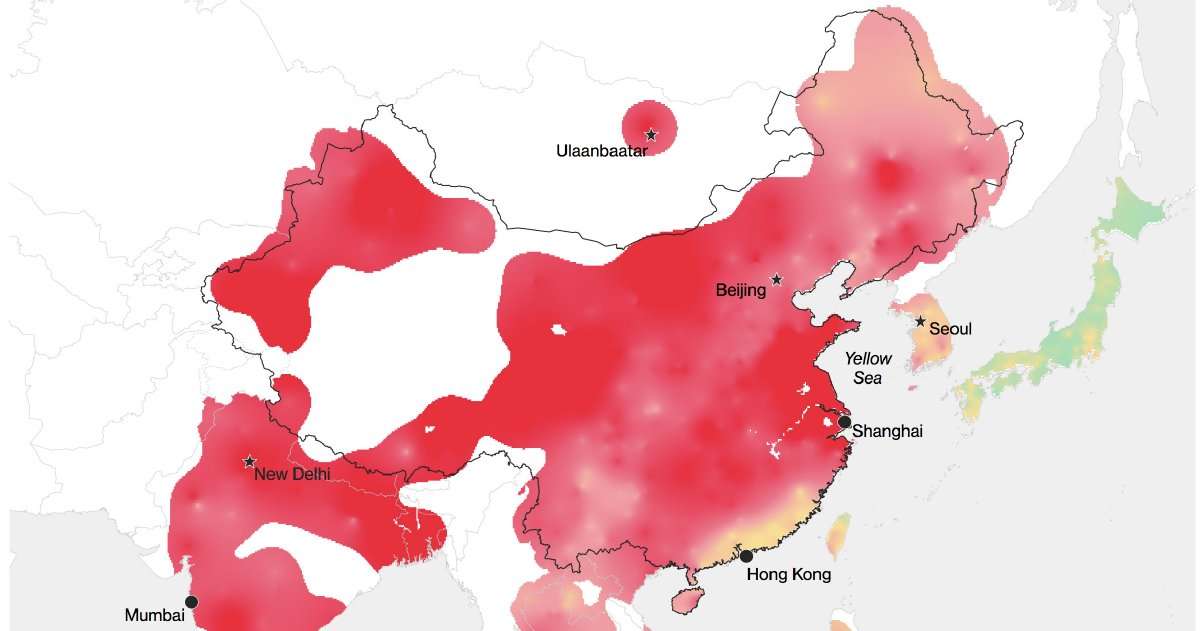
A Bad Winter Day PM 2.5 Concentration Estimate (µg/m3) as of January 31, 2018 Good Very Unhealthy Ulaanbaatar Beijing New Delhi Hong Kong Mumbai A Bad Winter Day PM 2.5 Concentration Estimate (µg/m3) as of January 31, 2018 Good 12 35.5 55.5 150.5 Very Unhealthy 250.5 Ulaanbaatar Beijing Seoul Yellow Sea Shanghai New Delhi Hong Kong Mumbai A Bad Winter Day PM 2.5 Concentration Estimate (µg/m3) as of January 31, 2018 Good 12 35.5 55.5 150.5 Very Unhealthy 250.5 Ulaanbaatar Beijing Seoul Yellow Sea Shanghai New Delhi Hong Kong Mumbai A Bad Winter Day PM 2.5 Concentration Estimate (µg/m3) as of January 31, 2018 Good 12 35.5 55.5 150.5 Very Unhealthy 250.5 Ulaanbaatar Beijing Seoul Yellow Sea Shanghai New Delhi Hong Kong Mumbai Source: Berkeley Earth (see footnote for methodology)
China’s air pollution is so extreme that in 2015, independent research group Berkeley Earth estimated it contributed to 1.6 million deaths per year in the country. The smog is heaviest in northern industrial provinces such as Shanxi, the dominant coal mining region, and steel-producing Hebei. Emissions there contribute to the planet’s largest mass of PM 2.5 air pollution—the particles which pose the greatest health risks because they can become lodged in the lungs. It can stretch from Mongolia to the Yellow Sea and often as far as South Korea. Leaders at the congress said they will raise spending to curb pollution by 19 percent over the previous year to 40.5 billion yuan ($6.4 billion) and aim to cut sulfur dioxide and nitrogen oxide emissions by 3 percent. They said heavy air pollution days in key cities are down 50 percent in five years.
Carbon Dioxide Emissions Tons of Carbon Dioxide 10B December 2001: China joins WTO China 8B 6B U.S. 4B India 2B Japan Germany 0 1966 2016 Carbon Dioxide Emissions Tons of Carbon Dioxide 10B December 2001: China joins WTO China 8B 6B U.S. 4B India 2B Japan Germany 0 1966 2016 Carbon Dioxide Emissions Tons of Carbon Dioxide 10B December 2001: China joins WTO China 8B 6B U.S. 4B India 2B Japan Germany 0 1966 2016 Source: BP Statistical Review of World Energy
The country had become the world’s No.1 carbon dioxide emitter as it rose to dominate global exports, a process which began several decades ago but got its biggest lift with World Trade Organization entry in 2001. Emissions have started to fall again.
The government’s war on air pollution fits neatly with another goal: domination of the global electric-vehicle industry. Elon Musk’s Tesla Inc. might be the best-known name, but China has been the global leader in EV sales since 2015, and is aiming for 7 million annual sales by 2025.
Annual EV Sales Rest of World 35M 30M 25M China 20M 15M U.S. 10M 5M Japan 0 2015 2040 Annual EV Sales 35M Rest of World 30M 25M 20M China 15M U.S. 10M 5M Japan 0 2015 2040 Annual EV Sales 35M Rest of World 30M 25M 20M China 15M U.S. 10M 5M Japan 0 2015 2040 Source: Bloomberg New Energy Finance
To get there, it’s subsidizing manufacturers and tightening regulation around traditional fossil-fuel powered cars. Beneficiaries include BYD Co., a Warren Buffett-backed carmaker that soared 67 percent last year and sold more cars than Tesla. Goldman Sachs Group Inc. has a buy rating on shares of Geely Automobile Holdings Ltd.
Worldwide, solar panel prices are plunging—allowing a faster shift away from carbon—thanks to the sheer scale of China’s clean-energy investment. It’s spending more than twice as much as the U.S. Two-thirds of solar panels are produced in China, BNEF estimates, and it’s home to global leaders, including JinkoSolar Holding Co. and Yingli Green Energy Holding Co.
Solar Installs 700K Projection 600K Rest of World 500K India 400K U.S. Germany 300K Japan 200K China 100K 0 2009 2019 Solar Installs 700K Projection 600K Rest of World 500K India 400K U.S. Germany 300K Japan 200K China 100K 0 2009 2019 Solar Installs 700K Projection 600K Rest of World 500K India 400K U.S. Germany 300K Japan 200K China 100K 0 2009 2019 Source: Bloomberg New Energy Finance
But China isn’t stopping there. As well as wind and solar, it’s exploring frontier clean energy technologies like hydrogen as an alternative to coal.
The trend towards clean energy is poised to keep gathering steam worldwide. BNEF projects global investment in new power generation capacity will exceed $10 trillion between 2017 and 2040. Of this, about 72 percent is projected to go toward renewable energy, roughly evenly split between wind and solar.
China’s efforts to cut excess industrial capacity overlap with the imperative to clean up the environment. Combined, those forces have had a hefty impact on commodity prices. Coal, steel, and aluminum prices soared last year as factories shut and mines closed. Under the weight of new rules on pollutant discharge, paper prices did the same. Some markets have recovered somewhat since then, some haven’t.
Commodities Thermal coal (Per metric ton) $115.1 $87.2 2018 2017 Steel rebar (Per metric ton) $503.7 $657.7 2018 2017 Aluminium (Per metric ton) $2,207 $1,713 2018 2017 Paper products (Producer Price index) 10.7% 6.7% 01/2017 12/2017 Commodities Thermal coal (Per metric ton) Steel rebar (Per metric ton) $115.1 $503.7 $657.7 $87.2 2017 2018 2017 2018 Aluminium (Per metric ton) Paper products (Producer Price index) $2,207 10.7% 6.7% $1,713 2017 2018 01/2017 12/2017 Commodities Thermal coal (Per metric ton) Steel rebar (Per metric ton) Aluminium (Per metric ton) Paper products (Producer Price index) $115.1 $2,207 $503.7 10.7% $657.7 $87.2 6.7% $1,713 2017 2018 2017 2018 2017 2018 01/2017 12/2017 Commodities Paper products (Producer Price index) Thermal coal (Per metric ton) Steel rebar (Per metric ton) Aluminium (Per metric ton) $115.1 $2,207 $503.7 10.7% $657.7 $87.2 6.7% $1,713 2017 2018 2017 2018 2017 2018 01/2017 12/2017 Source: Data compiled by Bloomberg, China Coal Resource, National Bureau of Statistics
QuitMessingwithme on March 12nd, 2018 at 23:30 UTC »
I applaud China for taking a step in the right direction.... but to people here thinking its a green paradise, step back and get a dose of reality. Chinese pollution is so bad, it would make 1980's LA look like a green paradise.
ninjamiguel74 on March 12nd, 2018 at 21:56 UTC »
I guess 1984 without pollution is better that 1984 with pollution
whatthefuckingwhat on March 12nd, 2018 at 19:06 UTC »
This is what makes no sense to me, why is the west not doing as much as China to develop and produce electric cars for the masses...China is way ahead of the west and even tesla in innovation but the vehicles are not available to export just yet.